Avon 2009 Annual Report Download - page 36
Download and view the complete annual report
Please find page 36 of the 2009 Avon annual report below. You can navigate through the pages in the report by either clicking on the pages listed below, or by using the keyword search tool below to find specific information within the annual report.-
 1
1 -
2
-
3
-
4
-
5
-
6
-
7
-
8
-
9
-
10
-
11
-
12
-
13
-
14
-
15
-
16
-
17
-
18
-
19
-
20
-
21
-
22
-
23
-
24
-
25
-
 26
26 -
 27
27 -
 28
28 -
 29
29 -
 30
30 -
 31
31 -
 32
32 -
 33
33 -
 34
34 -
 35
35 -
 36
36 -
 37
37 -
 38
38 -
 39
39 -
 40
40 -
 41
41 -
 42
42 -
 43
43 -
 44
44 -
 45
45 -
 46
46 -
47
-
48
-
49
-
50
-
51
-
52
-
53
-
54
-
55
-
56
-
57
-
58
-
59
-
60
-
61
-
62
-
63
-
64
-
65
-
66
-
67
-
68
-
69
-
70
-
71
-
72
-
73
-
74
-
75
-
76
-
77
-
78
-
79
-
80
-
81
-
82
-
83
-
84
-
85
-
86
-
87
-
88
-
89
-
90
-
91
-
92
-
93
-
94
-
95
-
96
-
97
-
98
-
99
-
100
-
101
-
102
-
103
-
104
-
105
-
106
 |
 |

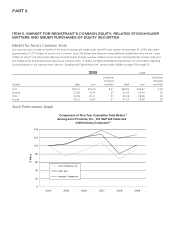
PART II
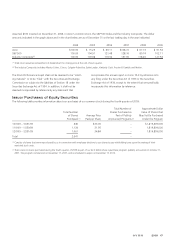
(Dollars in millions, except per share data)
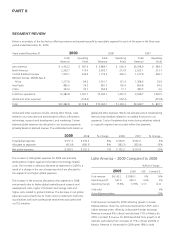
ITEM 6. SELECTED FINANCIAL DATA
We derived the following selected financial data from our audited consolidated financial statements. The following data should be read in
conjunction with our MD&A and our Consolidated Financial Statements and related Notes.
2009 2008 2007 (2) 2006 (3) 2005
Income Data
Total revenue $10,382.8 $10,690.1 $9,938.7 $8,763.9 $8,149.6
Operating profit (1) 1,018.2 1,339.3 872.7 761.4 1,149.0
Net income 625.8 875.3 530.7 477.6 847.6
Diluted earnings per share (4) $1.45 $2.03 $1.21 $1.06 $1.80
Cash dividends per share $0.84 $0.80 $0.74 $0.70 $0.66
Balance Sheet Data
Total assets $6,832.7 $6,074.0 $5,716.2 $5,238.2 $4,761.4
Debt maturing within one year 138.1 1,031.4 929.5 615.6 882.5
Long-term debt 2,307.8 1,456.2 1,167.9 1,170.7 766.5
Total debt 2,445.9 2,487.6 2,097.4 1,786.3 1,649.0
Total shareholders' equity (5) 1,312.6 712.3 749.8 827.4 834.1
(1) Anumber of items, shown below, impact the comparability of our operating profit. See Note 14, Restructuring Initiatives and Note 9, Share-Based Compen-
sation Plans, to this 2009 Annual Report for more information on these items.
2009 2008 2007 2006 2005
Costs to implement restructuring initiatives related to
our multi-year restructuring programs $171.4 $60.6 $158.3 $228.8 $56.5
Inventory obsolescence expense (benefit) related to
our product line simplification program –(13.0) 167.3 72.6 –
Share-based compensation 54.9 54.8 61.6 62.9 10.1
(2) In 2007, we recorded adecrease of $18.3 to shareholders’ equity from the initial adoption of the provisions for recognizing and measuring tax positions
taken or expected to be taken in atax return that affect amounts reported in the financial statements as required by the Income Taxes Topic of the FASB
Accounting Standards Codification (the “Codification”).
(3) In 2006, we recorded adecrease of $232.8 to total assets and $254.7 to shareholders’ equity from the initial adoption of the provisions for the recognition of
the funded status of pension and other postretirement benefit plans on the balance sheet as required by the Compensation –Retirement Benefits Topic of the
Codification.
(4) In 2009, we adopted the provisions required by the EPS Topic of the Codification. The specific provisions address whether instruments granted in share-based
payment awards are participating securities prior to vesting and, therefore, need to be included in theearnings allocation in computing EPS under thetwo-class
method. Prior periods EPS was adjusted retrospectively which caused the December 31, 2008 diluted EPS to be adjusted from $2.04 to $2.03 and the
December 31, 2005 diluted EPS to be adjusted from $1.81 to $1.80.
(5) In 2009, we adopted the provisions for the accounting and reporting of noncontrolling interests in asubsidiary in consolidated financial statements as
required by the Consolidations Topic of the Codification. These provisions recharacterize minority interests as noncontrolling interests and require noncon-
trolling interests to be classified as acomponent of shareholders’ equity. These provisions require retroactive adoption of the presentation and disclosure
requirements for existing minority interests. As aresult of the adoption of these provisions, we reclassified minority interest of $37.4, $38.2, $37.0 and $39.9
from other liabilities to shareholders’ equity on the Consolidated Balance Sheet at December 31, 2008, 2007, 2006 and 2005, respectively.