Avon 2009 Annual Report Download - page 84
Download and view the complete annual report
Please find page 84 of the 2009 Avon annual report below. You can navigate through the pages in the report by either clicking on the pages listed below, or by using the keyword search tool below to find specific information within the annual report.-
 1
1 -
2
-
3
-
4
-
5
-
6
-
7
-
8
-
9
-
10
-
11
-
12
-
13
-
14
-
15
-
16
-
17
-
18
-
19
-
20
-
21
-
22
-
23
-
24
-
25
-
26
-
27
-
28
-
29
-
30
-
31
-
32
-
33
-
34
-
35
-
36
-
37
-
38
-
39
-
40
-
41
-
42
-
43
-
44
-
45
-
46
-
47
-
48
-
49
-
50
-
51
-
52
-
53
-
54
-
55
-
56
-
57
-
58
-
59
-
60
-
61
-
62
-
63
-
64
-
65
-
66
-
67
-
68
-
69
-
70
-
71
-
72
-
73
-
 74
74 -
 75
75 -
 76
76 -
 77
77 -
 78
78 -
 79
79 -
 80
80 -
 81
81 -
 82
82 -
 83
83 -
 84
84 -
 85
85 -
 86
86 -
 87
87 -
 88
88 -
 89
89 -
 90
90 -
 91
91 -
 92
92 -
 93
93 -
 94
94 -
95
-
96
-
97
-
98
-
99
-
100
-
101
-
102
-
103
-
104
-
105
-
106
 |
 |

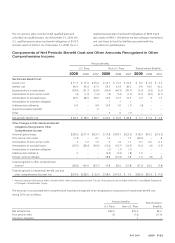
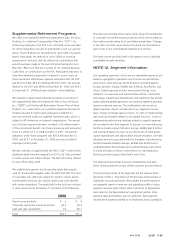
NOTES TO CONSOLIDATED FINANCIAL STATEMENTS
Asummary of stock options as of December 31, 2009, and changes during 2009, is as follows:
Shares
(in 000’s)
Weighted-
Average
Exercise
Price
Weighted-
Average
Contractual
Term
Aggregate
Intrinsic
Value
Outstanding at January 1, 2009 23,261 $34.85
Granted 6,988 15.61
Exercised (563) 23.34
Forfeited (364) 23.95
Expired (838) 32.78
Outstanding at December 31, 2009 28,484 $30.56 6.2 $137.6
Exercisable at December 31, 2009 18,071 $34.57 4.7 $30.0
At December 31, 2009, there was approximately $19.0 of unrecog-
nized compensation cost related to stock options outstanding.
That cost is expected to be recognized over aweighted-average
period of 1.3 years. We recognize expense on stock options using
agraded vesting method, which recognizes the associated
expense based on the timing of option vesting dates.
Cash proceeds, taxbenefits, and intrinsic value related to total stock
options exercised during 2009, 2008 and 2007, were as follows:
2009 2008 2007
Cash proceeds from stock
options exercised $13.1 $81.4 $85.5
Tax benefit realized for stock
options exercised .9 12.2 16.8
Intrinsic value of stock
options exercised 5.0 41.5 50.5
Restricted Stock and Restricted Stock
Units
The fair value of restricted stock and restricted stock units granted
was determined based on the closing price of our common stock
on the date of grant.
Asummary of restricted stock and restricted stock units at
December 31, 2009, and changes during 2009, is as follows:
Restricted
Stock
And Units
(in 000’s)
Weighted-
Average
Grant-Date
Fair Value
Nonvested at January 1, 2009 2,854 $35.75
Granted 1,726 18.43
Vested (979) 30.94
Forfeited (164) 26.39
Nonvested at December 31, 2009 3,437 $29.68
The total fair value of restricted stock and restricted stock units that
vested during 2009 was $18.1, based upon market prices on the
vesting dates. As of December 31, 2009, there was approximately
$31.7 of unrecognized compensation cost related to restricted
stock and restricted stock unit compensation arrangements. That
cost is expected to be recognized over aweighted-average period
of 1.8 years.
NOTE 10. Shareholders’ Equity
Stock Repurchase Program
In February 2005, our Board approved afive-year, $1,000.0 share
repurchase program to begin upon completion of our previous
share repurchase program. This $1,000.0 program was completed
during December 2007. In October 2007, our Board of Directors
approved afive-year $2,000.0 share repurchase program (“$2.0
billion program”) which began in December 2007. We have repur-
chased approximately 4.8 million shares for $180.2 under the $2.0
billion program through December 31, 2009.