Avon 2009 Annual Report Download - page 45
Download and view the complete annual report
Please find page 45 of the 2009 Avon annual report below. You can navigate through the pages in the report by either clicking on the pages listed below, or by using the keyword search tool below to find specific information within the annual report.-
 1
1 -
2
-
3
-
4
-
5
-
6
-
7
-
8
-
9
-
10
-
11
-
12
-
13
-
14
-
15
-
16
-
17
-
18
-
19
-
20
-
21
-
22
-
23
-
24
-
25
-
26
-
27
-
28
-
29
-
30
-
31
-
32
-
33
-
34
-
 35
35 -
 36
36 -
 37
37 -
 38
38 -
 39
39 -
 40
40 -
 41
41 -
 42
42 -
 43
43 -
 44
44 -
 45
45 -
 46
46 -
 47
47 -
 48
48 -
 49
49 -
 50
50 -
 51
51 -
 52
52 -
 53
53 -
 54
54 -
 55
55 -
56
-
57
-
58
-
59
-
60
-
61
-
62
-
63
-
64
-
65
-
66
-
67
-
68
-
69
-
70
-
71
-
72
-
73
-
74
-
75
-
76
-
77
-
78
-
79
-
80
-
81
-
82
-
83
-
84
-
85
-
86
-
87
-
88
-
89
-
90
-
91
-
92
-
93
-
94
-
95
-
96
-
97
-
98
-
99
-
100
-
101
-
102
-
103
-
104
-
105
-
106
 |
 |
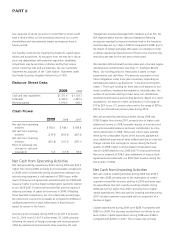
Gross Margin
Gross margin for2009 decreased by 0.5 points. The unfavorable
impact of foreign exchange transactions lowered gross margin by
an estimated 1.7 points for2009. Aportion of this negative impact
from foreign exchange transactions was offset through strong
manufacturingproductivity gains which includes benefits from SSI
and strategic price increases. 2008 gross margin included benefits
of approximately $13 of reduced obsolescence from changes in
estimates to our disposition plan under our PLS program.
Gross margin increased 2.8 points in 2008 as compared to 2007,
primarily due to adecrease in inventory obsolescence provisions
in 2008, which benefited gross margin by 2.0 points, and from
increased pricing and favorable product mix, which benefited
gross margin by 1.3 points. These benefits to gross margin were
partially offset by higher commodity costs and the unfavorable
impact of foreign exchange on product cost in Europe. 2007
included incremental inventory obsolescence charges of $167.3
related to our PLS program. Obsolescence expense for 2008 also
benefited by approximately $13 from changes in estimates to
our disposition plan under our PLS program.
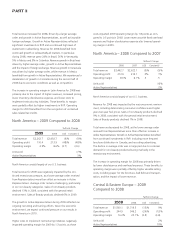
Selling, General and Administrative
Expenses
Selling, general and administrative expenses increased $74.6
during 2009 as compared to 2008, due to higher costs incurred
under our restructuring initiatives, partially offset by lower adver-
tising costs. We recorded charges under our 2005 and 2009
Restructuring Programs of $164.7 during 2009, as compared to
$57.5 during 2008.
Selling, general and administrative expenses increased $276.9
during 2008 as compared to 2007, primarily due to the following:
•higher investments in RVP and advertising of approximately
$105;
•higher variable expenses such as freight from increased sales
volume and brochure costs;
•higher overhead primarily due to higher marketing costs; and
•the impact of foreign exchange.
These higher costs during 2008 as compared to 2007 were parti-
ally offset by lower costs incurred to implement our restructuring
initiatives of $99.8, due to costs associated with previously
approved initiatives.
See the “Segment Review” section of MD&A for additional
information related to changes in operating margin by segment.
Other Expenses
Interest expense increased by 4% in 2009 as compared to 2008,
due to increased borrowings, partially offset by lower interest
rates. Interest expense decreased by 11% in 2008 as compared
to 2007, primarily due to lower domestic interest rates. At
December 31, 2009, we held interest-rate swap agreements that
effectively converted approximately 82% of our outstanding
long-term, fixed-rate borrowings to avariable interest rate based
on LIBOR, as compared to 50% at December 31, 2008.
Interest income decreased in both 2009 and 2008, primarily due
to lower interest rates.
Other expense, net for 2009 was lower than during 2008 as a
result of lower foreign exchange losses. Other expense, net
increased in 2008, primarily due to net foreign exchange losses
in 2008, as compared to foreign exchange gains in 2007.
Effective Tax Rate
The effective tax rate for 2009 was 32.2%, compared to 29.3%
for 2008 and 33.0% for 2007.
The effective tax rate for 2009 was unfavorably impacted by
3.4 points from theestablishment of avaluation allowance against
certain deferred tax assets primarily as aresult of restructuring
activities, partially offset by 2.4points from areduction in aforeign
tax liability. The 2009 rate also included ahigher taxcost associated
with the repatriation of current year earnings offset by favorable
changes in the earnings mix of international subsidiaries.
The effective tax rate for 2008 was favorably impacted by 3.8
points due to an audit settlement, partially offset by 1.2 points
from the establishment of avaluation allowance against certain
deferred tax assets. The 2008 rate also benefited from changes
in the earnings mix of international subsidiaries.
The effective taxrate for 2007 was favorably impacted by 2.0
points due to the net releaseofvaluation allowances, partially off-
set by theunfavorable impact of restructuring and PLS initiatives.
AVON2009 27