Avon 2009 Annual Report Download - page 52
Download and view the complete annual report
Please find page 52 of the 2009 Avon annual report below. You can navigate through the pages in the report by either clicking on the pages listed below, or by using the keyword search tool below to find specific information within the annual report.-
 1
1 -
2
-
3
-
4
-
5
-
6
-
7
-
8
-
9
-
10
-
11
-
12
-
13
-
14
-
15
-
16
-
17
-
18
-
19
-
20
-
21
-
22
-
23
-
24
-
25
-
26
-
27
-
28
-
29
-
30
-
31
-
32
-
33
-
34
-
35
-
36
-
37
-
38
-
39
-
40
-
41
-
 42
42 -
 43
43 -
 44
44 -
 45
45 -
 46
46 -
 47
47 -
 48
48 -
 49
49 -
 50
50 -
 51
51 -
 52
52 -
 53
53 -
 54
54 -
 55
55 -
 56
56 -
 57
57 -
 58
58 -
 59
59 -
 60
60 -
 61
61 -
 62
62 -
63
-
64
-
65
-
66
-
67
-
68
-
69
-
70
-
71
-
72
-
73
-
74
-
75
-
76
-
77
-
78
-
79
-
80
-
81
-
82
-
83
-
84
-
85
-
86
-
87
-
88
-
89
-
90
-
91
-
92
-
93
-
94
-
95
-
96
-
97
-
98
-
99
-
100
-
101
-
102
-
103
-
104
-
105
-
106
 |
 |

PART II
Any issuances of equity securities or convertible securities could
have adilutive effect on the ownership interest of our current
shareholders and may adversely impact earnings per share in
future periods.
Our liquidity could also be impacted by dividends, capital expen-
ditures and acquisitions. At any given time, we may be in discus-
sions and negotiations with potential acquisition candidates.
Acquisitions may be accretive or dilutive and by their nature
involve numerous risks and uncertainties. See our Cautionary
Statement for purposes of the “Safe Harbor” Statement under
the Private Securities Litigation Reform Act of 1995.
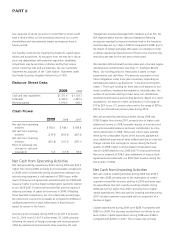
Balance Sheet Data
2009 2008
Cash and cash equivalents $1,311.6 $1,104.7
Total debt 2,445.9 2,487.6
Working capital 1,914.5 644.7
Cash Flows
2009 2008 2007
Net cash from operating
activities $782.0 $748.1 $589.8
Net cash from investing
activities (218.9) (403.4) (287.2)
Net cash from financing
activities (361.8) (141.5) (597.1)
Effect of exchange rate
changes on cash and
equivalents 5.6 (61.9) 59.0
Net Cash from Operating Activities
Net cash provided by operating activities during 2009 was $33.9
higher than during 2008, primarily due to favorable comparisons
to 2008, which included the timing of payments relating to our
restructuring programs, acash payment of $38.0 upon settle-
ment of treasury lock agreements associated with our 2008 debt
issuance, higher incentive based compensation payments related
to our 2006-2007 Turnaround Incentive Plan and the impact of
advance purchases of paper for brochures in 2008. Offsetting
these favorable comparisons, are net unfavorable working capi-
tal movements in accounts receivable as compared to 2008 and
additional payments of value added taxes in Brazil that we
expect to recover in the future.
Inventory levels increased during 2009, to $1,067.5 at Decem-
ber 31, 2009, from $1,007.9 at December 31, 2008, primarily
reflecting the impact of foreign exchange and business growth
offset by operational improvements. New inventory life cycle
management processes leveraged with initiatives such as PLS, SSI,
ERP implementation and the Sales and Operations Planning
process are expected to improve inventory levelsinthe long-term.
Inventory days are up 7days in 2009 as compared to 2008, due to
the impactofforeign exchange. We expectour initiatives to help
us deliver operational improvementsofthree to five inventory day
reductions per year for thenext two to three years.
We maintain defined benefit pension plans and unfunded supple-
mental pension benefit plans (see Note 11, Employee Benefit
Plans). Our funding policy for these plans is based on legal
requirements and cash flows. The amounts necessary to fund
future obligations under these plans could vary depending on
estimated assumptions (as detailed in “Critical Accounting Esti-
mates”). The future funding for these plans will depend on eco-
nomic conditions, employee demographics, mortality rates, the
number of associates electing to take lump-sum distributions,
investment performance and funding decisions. Based on current
assumptions, we expect to make contributions in the range of
$15 to $20 to our U.S. pension plans and in the range of $30 to
$40 to our international pension plans during 2010.
Net cash provided by operating activities during 2008 was
$158.3 higher than during 2007, primarily due to higher cash-
related net income in 2008, favorable impacts of inventory and
accounts receivable balances and lower contributions to retire-
ment-related plans in 2008. These cash inflows were partially
offset by the unfavorable impact of the accounts payable bal-
ance, additional payments of value added taxes due to atax law
change in Brazil that we began to recover during the fourth
quarter of 2008, higher incentive-based compensation pay-
ments in 2008 related to our 2006-2007 Turnaround Incentive
Plan and apayment of $38.0 upon settlement of treasury lock
agreements associated with our $500 debt issuance during the
first quarter of 2008.
Net Cash from Investing Activities
Net cash used by investing activities during 2009 was $184.5
lower than 2008, primarily due to the redemption of certain
corporate-owned life insurance policies in 2009 and lower capi-
tal expenditures. Net cash used by investing activities during
2008 was $116.2 higher than 2007, primarily due to higher
capital expenditures. Net cash used by investing activities during
2007 included apayment associated with an acquisition of a
licensee in Egypt.
Capital expenditures during 2009 were $296.9 compared with
$380.5 in 2008. This decrease resulted from our efforts to pre-
serve capital. Capital expenditures during 2008 were $380.5
compared with $278.5 in 2007. This increase was primarily