Avon 2009 Annual Report Download - page 7
Download and view the complete annual report
Please find page 7 of the 2009 Avon annual report below. You can navigate through the pages in the report by either clicking on the pages listed below, or by using the keyword search tool below to find specific information within the annual report.
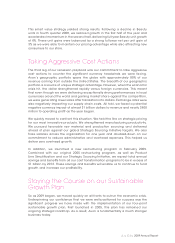
This smart value strategy yielded strong results. Following a decline in Beauty
units in fourth quarter 2008, we restored growth in the first half of the year and
accelerated momentum in the second half, delivering full-year Beauty unit growth
of 4%. These unit gains were balanced by a strong full-year net per unit gain of
3% as we were able to maintain our pricing advantage while also attracting new
consumers to our store.
Taking Aggressive Cost Actions
The third leg of our recession playbook was our commitment to take aggressive
cost actions to counter the significant currency headwinds we were facing.
Avon’s geographic portfolio spans the globe with approximately 80% of our
revenue coming from outside the United States. The breadth of our geographic
portfolio is a source of unique strategic advantage. However, when the economic
crisis hit, the dollar strengthened rapidly versus foreign currencies. This meant
that even though we were delivering exceptionally strong performances in local
currencies around the world and gaining market share against the competition,
we were generating lower sales after translation into dollars. Exchange rates were
also negatively impacting our supply chain costs. All told, we faced a potential
negative currency impact of almost $1 billion dollars to revenue and nearly $400
million to operating profit as the year began.
We quickly moved to confront this situation. We held the line on strategic pricing
for our most innovative products. We strengthened manufacturing productivity.
We pursued favorable raw material and production sourcing and delivered
ahead of plan against our global Strategic Sourcing Initiative targets. We also
froze salaries across the organization for one year and doubled-down on our
commitment to reduce administrative and overhead expenses. This helped us
deliver zero overhead growth.
In addition, we launched a new restructuring program in February 2009.
Combined with our original 2005 restructuring program, as well as Product
Line Simplification and our Strategic Sourcing Initiative, we expect total annual
savings and benefits from all our cost transformation programs to be in excess of
$1 billion by 2013. These savings and benefits will enable us to continue to fund
growth and increase our profitability.
Staying the Course on our Sustainable
Growth Plan
So as 2009 began, we moved quickly on all fronts to outrun the economic crisis.
Underpinning our confidence that we were well-positioned for success was the
significant progress we have made with the implementation of our four-point
sustainable growth plan. First launched in 2005, this plan has remained our
ongoing strategic roadmap. As a result, Avon is fundamentally a much stronger
business today.
2009 Annual Report
0394_Narr 5

