Avon 2009 Annual Report Download - page 51
Download and view the complete annual report
Please find page 51 of the 2009 Avon annual report below. You can navigate through the pages in the report by either clicking on the pages listed below, or by using the keyword search tool below to find specific information within the annual report.-
 1
1 -
2
-
3
-
4
-
5
-
6
-
7
-
8
-
9
-
10
-
11
-
12
-
13
-
14
-
15
-
16
-
17
-
18
-
19
-
20
-
21
-
22
-
23
-
24
-
25
-
26
-
27
-
28
-
29
-
30
-
31
-
32
-
33
-
34
-
35
-
36
-
37
-
38
-
39
-
40
-
 41
41 -
 42
42 -
 43
43 -
 44
44 -
 45
45 -
 46
46 -
 47
47 -
 48
48 -
 49
49 -
 50
50 -
 51
51 -
 52
52 -
 53
53 -
 54
54 -
 55
55 -
 56
56 -
 57
57 -
 58
58 -
 59
59 -
 60
60 -
 61
61 -
62
-
63
-
64
-
65
-
66
-
67
-
68
-
69
-
70
-
71
-
72
-
73
-
74
-
75
-
76
-
77
-
78
-
79
-
80
-
81
-
82
-
83
-
84
-
85
-
86
-
87
-
88
-
89
-
90
-
91
-
92
-
93
-
94
-
95
-
96
-
97
-
98
-
99
-
100
-
101
-
102
-
103
-
104
-
105
-
106
 |
 |

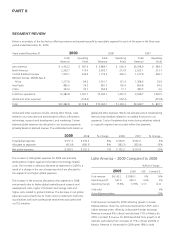
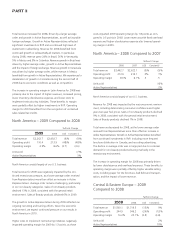
Operating margin increased for 2008, primarily due to the
impact of lower inventory obsolescence expense, increased pric-
ing and lower overhead expenses, partially offset by higher
spending on RVP and an unfavorable mix of products sold.
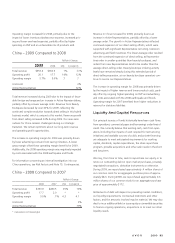
China –2009 Compared to 2008
%/Point Change
2009 2008 US$ Constant $
Total revenue $353.4 $350.9 1% (1)%
Operating profit 20.1 17.7 14% 12%
Operating margin 5.7% 5.0% .7 .7
Units sold 3%
Active Representatives 32%
Total revenue increased during 2009 due to the impact of favor-
able foreign exchange and an increase in Active Representatives,
partially offset by alower average order. Revenue from Beauty
Boutiques decreased by over 40% for 2009, reflecting the
continued complex evolution towards direct selling in this hybrid
business model, which is unique to this market. Revenue growth
from direct selling increased 24% during 2009. Our near-term
outlook for China remains challenged during our strategic
transition. We remain optimistic about our long-term revenue
and operating profit opportunities.
The increase in operating margin for 2009 was primarily driven
by lower advertising costs and cost saving initiatives. Alower
gross margin offset these operating margin benefits for 2009.
Additionally, the 2008 operating margin was negatively impacted
by costs associated with the 2008 earthquake and floods.
For information concerning an internal investigation into our
China operations, see Risk Factors and Note 15, Contingencies.
China –2008 Compared to 2007
%/Point Change
2008 2007 US$ Constant $
Total revenue $350.9 $280.5 25% 14%
Operating profit 17.7 2.0 **
Operating margin 5.0% .7% 4.3 4.1
Units sold 2%
Active Representatives 79%
*Calculation not meaningful
Revenue in China increased for 2008, primarily due to an
increase in Active Representatives, partially offset by alower
average order. The growth in Active Representatives reflected
continued expansion of our direct-selling efforts, which were
supported with significant Representative recruiting, television
advertising and field incentives. The lower average order resulted
from the continued expansion of direct selling, as Representa-
tives order in smaller quantities than beauty boutiques, and
orders from new Representatives tend to be smaller than the
average direct-selling order. Beauty boutique ordering activity
levels have remained steady during this extended period of
direct-selling expansion, as our beauty boutique operators con-
tinue to service our Representatives.
The increase in operating margin for 2008 was primarily driven
by the impact of higher revenue and lower product costs, parti-
ally offset by ongoing higher spending on RVP and advertising
and costs associated with the 2008 earthquake and floods.
Operating margin for 2007 benefited from higher reductions in
reserves for statutory liabilities.
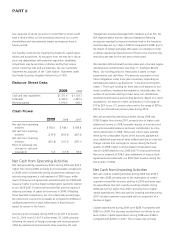
Liquidity And Capital Resources
Our principal sources of funds historically have been cash flows
from operations, commercial paper and borrowings under lines of
credit. We currently believe that existing cash, cash from oper-
ations (including the impacts of cash required for restructuring
initiatives) and available sources of public and private financing
are adequate to meet anticipated requirements for working
capital, dividends, capital expenditures, the share repurchase
program, possible acquisitions and other cash needs in the short
and long term.
We may, from time to time, seek to repurchase our equity or to
retire our outstanding debt in open market purchases, privately
negotiated transactions,derivative instruments or otherwise.
During 2009, we repurchased approximately.4million shares of
our common stock for an aggregate purchase price of approx-
imately $8.6. During 2008, we repurchased approximately 4.6
million shares of our common stock for an aggregate purchase
price of approximately $172.
Retirements of debt will depend on prevailing market conditions,
our liquidity requirements, contractual restrictions and other
factors, and the amounts involved may be material. We may also
elect to incur additional debt or issue equity or convertible securities
to finance ongoing operations, acquisitions or to meet our other
liquidity needs.
AVON2009 33