Avon 2009 Annual Report Download - page 44
Download and view the complete annual report
Please find page 44 of the 2009 Avon annual report below. You can navigate through the pages in the report by either clicking on the pages listed below, or by using the keyword search tool below to find specific information within the annual report.-
 1
1 -
2
-
3
-
4
-
5
-
6
-
7
-
8
-
9
-
10
-
11
-
12
-
13
-
14
-
15
-
16
-
17
-
18
-
19
-
20
-
21
-
22
-
23
-
24
-
25
-
26
-
27
-
28
-
29
-
30
-
31
-
32
-
33
-
 34
34 -
 35
35 -
 36
36 -
 37
37 -
 38
38 -
 39
39 -
 40
40 -
 41
41 -
 42
42 -
 43
43 -
 44
44 -
 45
45 -
 46
46 -
 47
47 -
 48
48 -
 49
49 -
 50
50 -
 51
51 -
 52
52 -
 53
53 -
 54
54 -
55
-
56
-
57
-
58
-
59
-
60
-
61
-
62
-
63
-
64
-
65
-
66
-
67
-
68
-
69
-
70
-
71
-
72
-
73
-
74
-
75
-
76
-
77
-
78
-
79
-
80
-
81
-
82
-
83
-
84
-
85
-
86
-
87
-
88
-
89
-
90
-
91
-
92
-
93
-
94
-
95
-
96
-
97
-
98
-
99
-
100
-
101
-
102
-
103
-
104
-
105
-
106
 |
 |

PART II
Loss Contingencies
We determine whether to disclose and accrue for loss contingen-
cies based on an assessment of whether the risk of loss is remote,
reasonably possible or probable. Our assessment is developed
in consultation with our outside counsel and other advisors and is
based on an analysis of possible outcomes under various strategies.
Loss contingency assumptions involve judgments that are inherently
subjective and can involve matters that are in litigation, which, by
its nature is unpredictable. We believe that our assessment of the
probability of loss contingencies is reasonable, but becauseofthe
subjectivity involved and theunpredictable nature of thesubject
matteratissue, our assessmentmay prove ultimately to be incorrect,
which could materially impact the Consolidated Financial Statements.
RESULTS OF OPERATIONS –CONSOLIDATED
Favorable (Unfavorable)
%/Point Change
2009 2008 2007
2009 vs.
2008
2008 vs.
2007
Total revenue $10,382.8 $10,690.1 $9,938.7 (3)% 8%
Cost of sales 3,888.3 3,949.1 3,941.2 2% –%
Selling, general and administrative expenses 5,476.3 5,401.7 5,124.8 (1)% (5)%
Operating profit 1,018.2 1,339.3 872.7 (24)% 53%
Interest expense 104.8 100.4 112.2 (4)% 11%
Interest income (20.2) (37.1) (42.2) (46)% (12)%
Other expense, net 7.1 37.7 6.6 **
Net income attributable to Avon $625.8 $875.3 $530.7 (29)% 65%
Diluted earnings per share $1.45 $2.03 $1.21 (29)% 68%
Advertising expenses (1) $352.7 $390.5 $368.4 10% (6)%
Gross margin 62.6% 63.1% 60.3% (0.5) 2.8
Selling, general and administrative expenses as
a%oftotal revenue 52.7% 50.5% 51.6% (2.2) 1.1
Operating margin 9.8% 12.5% 8.8% (2.7) 3.7
Effective tax rate 32.2% 29.3% 33.0% (2.9) 3.7
Units sold 3% 1%
Active Representatives9%7%
*Calculation not meaningful
(1) Advertising expenses are included within selling, general and administrative expenses.
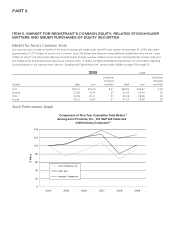
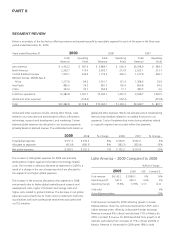
Total Revenue
Total revenue decreased 3% in 2009, with unfavorable foreign
exchange accounting for 9percentage points of the revenue
decline. Constant $revenue increased 6%, with increases in all
segments except North America and China. Active Representatives
increased 9%.
On acategory basis, Constant $Beauty sales increased 7%, while
Fashion increased 1% and Home increased 5%. Within the Beauty
category, Constant $sales of skincare decreased 1%, fragrance
increased 8%, personal care increased 9% and color cosmetics
increased 13%. On areported basis, the decrease in revenue for
2009 was primarily driven by adecrease of 3% in Beauty sales,
with decreases in all sub-categoriesofBeauty except color cosmet-
ics. Within the Beauty category, skincare declined 8%, fragrance
declined 2%, personal care declined 1% and color cosmetics
increased 3%. Fashion sales decreased 5% and Home sales
decreased 1%.
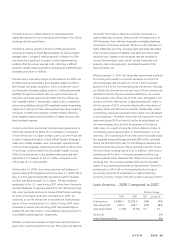
Total revenue increased 8% in 2008, with foreign exchange con-
tributing 3percentage points to the revenue growth. Revenue
grew in all segments, except North America. Revenue growth was
driven by an increase of 7% in Active Representatives.
On acategory basis, the 2008 increase in revenue was primarily
driven by an increase of 10% in Beauty sales, with increases in all
sub-categories of Beauty. Within the Beauty category, skin care
grew 10%, fragrance grew 9%, personal care grew 9% and color
cosmetics grew 11%. Fashion sales increased 6%, while Home
sales decreased 3%. On acategory basis, Constant $Beauty sales
increased 7%, while Fashion increased 5% and Home decreased
4%. Within the Beauty category, Constant $sales of skincare
increased 6%, fragrance increased 8%, personal care increased
7% and color cosmetics increased 8%.
For additional discussion of the changes in revenue by segment,
see the “Segment Review” section of this MD&A.