Air New Zealand 2011 Annual Report Download - page 75
Download and view the complete annual report
Please find page 75 of the 2011 Air New Zealand annual report below. You can navigate through the pages in the report by either clicking on the pages listed below, or by using the keyword search tool below to find specific information within the annual report.-
 1
1 -
2
-
3
-
4
-
5
-
6
-
7
-
8
-
9
-
10
-
11
-
12
-
13
-
14
-
15
-
16
-
17
-
18
-
19
-
20
-
21
-
22
-
23
-
24
-
25
-
26
-
27
-
28
-
29
-
30
-
31
-
32
-
33
-
34
-
35
-
36
-
37
-
38
-
39
-
40
-
41
-
42
-
43
-
44
-
45
-
46
-
47
-
48
-
49
-
50
-
51
-
52
-
53
-
54
-
55
-
56
-
57
-
58
-
59
-
60
-
61
-
62
-
63
-
64
-
 65
65 -
 66
66 -
 67
67 -
 68
68 -
 69
69 -
 70
70 -
 71
71 -
 72
72 -
 73
73 -
 74
74 -
 75
75 -
 76
76 -
 77
77 -
 78
78 -
 79
79 -
 80
80
 |
 |
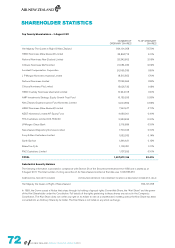
Shareholder Statistics – 3 August 2011
SIZE OF SHAREHOLDING SHAREHOLDERS SHARES
ORDINARY SHARES NUMBER % NUMBER %
1 to 1,000 16,648 63.89% 6,648,953 0.61%
1,001 to 5,000 6,753 25.91% 15,480,812 1.42%
5,001 to 10,000 1,340 5.14% 10,023,730 0.92%
10,001 to 100,000 1,225 4.70% 31,224,083 2.86%
100,001 and Over 93 0.36% 1,027,455,873 94.19%
TOTAL 26,059 100% 1,090,833,451 100%
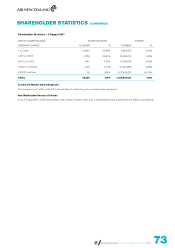
Current On-Market Share Buybacks
The Company is not, at the date of this Annual Report, undertaking any on-market share buy-backs.
Non-Marketable Parcels of Shares
As at 3 August 2011, 4,966 shareholders held Ordinary Shares of less than a marketable parcel (as defined by the NZSX Listing Rules).
SHAREHOLDER STATISTICS (CONTINUED)
AIR NEW ZEALAND ANNUAL FINANCIAL RESULTS 2011