Air New Zealand 2011 Annual Report Download - page 32
Download and view the complete annual report
Please find page 32 of the 2011 Air New Zealand annual report below. You can navigate through the pages in the report by either clicking on the pages listed below, or by using the keyword search tool below to find specific information within the annual report.-
 1
1 -
2
-
3
-
4
-
5
-
6
-
7
-
8
-
9
-
10
-
11
-
12
-
13
-
14
-
15
-
16
-
17
-
18
-
19
-
20
-
21
-
 22
22 -
 23
23 -
 24
24 -
 25
25 -
 26
26 -
 27
27 -
 28
28 -
 29
29 -
 30
30 -
 31
31 -
 32
32 -
 33
33 -
 34
34 -
 35
35 -
 36
36 -
 37
37 -
 38
38 -
 39
39 -
 40
40 -
 41
41 -
 42
42 -
43
-
44
-
45
-
46
-
47
-
48
-
49
-
50
-
51
-
52
-
53
-
54
-
55
-
56
-
57
-
58
-
59
-
60
-
61
-
62
-
63
-
64
-
65
-
66
-
67
-
68
-
69
-
70
-
71
-
72
-
73
-
74
-
75
-
76
-
77
-
78
-
79
-
80
 |
 |

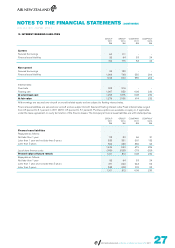
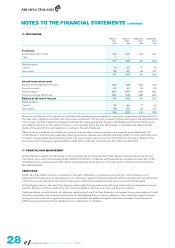
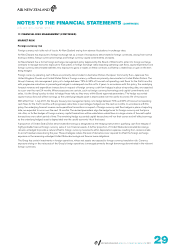
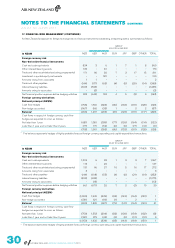
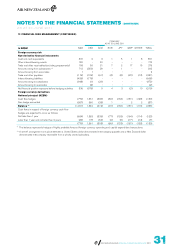
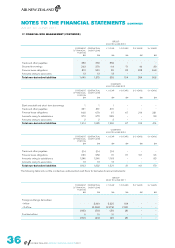
17. FINANCIAL RISK MANAGEMENT (CONTINUED)
Air New Zealand’s exposure to foreign exchange risk on financial instruments outstanding at reporting date is summarised as follows:
GROUP
AS AT 30 JUNE 2011
In NZ$M NZD USD AUD EUR JPY GBP OTHER TOTAL
Foreign currency risk
Non-derivative financial instruments
Cash and cash equivalents 834 3 6 1 7 1 8 860
Other interest-bearing assets 130 - 40 - - - - 170
Trade and other receivables (excluding prepayments) 171 66 32 7 3 17 15 311
Investment in quoted equity instruments - - 120 - - - - 120
Amounts owing from associates 1 1 - - - - - 2
Trade and other payables (144) (117) (65) (4) (5) (20) (14) (369)
Interest-bearing liabilities (660) (595) - - - - - (1,255)
Amounts owing to associates - (2) - - - - - (2)
Net financial position exposure before hedging activities 332 (644) 133 4 5 (2) 9 (163)
Foreign currency derivatives
Notional principal (NZ$M)
Cash flow hedges (758) 1,551 (393) (86) (133) (181) (128) (128)
Non-hedge accounted (567) 560 (35) 1 - 2 2 (37)
Balance* (993) 1,467 (295) (81) (128) (181) (117) (328)
Cash flows in respect of foreign currency cash flow
hedges are expected to occur as follows:
Not later than 1 year (681) 1,381 (339) (77) (128) (164) (114) (122)
Later than 1 year and not later than 2 years (77) 170 (54) (9) (5) (17) (14) (6)
(758) 1,551 (393) (86) (133) (181) (128) (128)
* The balance represents hedges of highly probable forecast foreign currency operating and capital expenditure transactions.
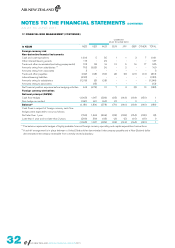
GROUP
AS AT 30 JUNE 2010
In NZ$M NZD USD AUD EUR JPY GBP OTHER TOTAL
Foreign currency risk
Non-derivative financial instruments
Cash and cash equivalents 1,009 6 38 1 3 3 7 1,067
Other interest-bearing assets 115 - 22 - - - - 137
Trade and other receivables (excluding prepayments) 131 66 27 10 5 16 17 272
Amounts owing from associates 3------3
Trade and other payables (144) (108) (55) (4) (6) (21) (14) (352)
Interest-bearing liabilities (453) (622) - - - - - (1,075)
Amounts owing to associates - (13) - - - - - (13)
Net financial position exposure before hedging activities 661 (671) 32 7 2 (2) 10 39
Foreign currency derivatives
Notional principal (NZ$M)
Cash flow hedges (1,050) 1,932 (339) (85) (143) (164) (150) 1
Non-hedge accounted (561) 621 (60) (1) - 2 - 1
Balance* (950) 1,882 (367) (79) (141) (164) (140) 41
Cash flows in respect of foreign currency cash flow
hedges are expected to occur as follows:
Not later than 1 year (759) 1,553 (296) (82) (138) (154) (132) (8)
Later than 1 year and not later than 2 years (291) 379 (43) (3) (5) (10) (18) 9
(1,050) 1,932 (339) (85) (143) (164) (150) 1
* The balance represents hedges of highly probable forecast foreign currency operating and capital expenditure transactions.
NOTES TO THE FINANCIAL STATEMENTS (CONTINUED)
AS AT 30 JUNE 2011
AIR NEW ZEALAND ANNUAL FINANCIAL RESULTS 2011