Air New Zealand 2011 Annual Report Download - page 7
Download and view the complete annual report
Please find page 7 of the 2011 Air New Zealand annual report below. You can navigate through the pages in the report by either clicking on the pages listed below, or by using the keyword search tool below to find specific information within the annual report.-
 1
1 -
 2
2 -
 3
3 -
 4
4 -
 5
5 -
 6
6 -
 7
7 -
 8
8 -
 9
9 -
 10
10 -
 11
11 -
 12
12 -
 13
13 -
 14
14 -
 15
15 -
 16
16 -
 17
17 -
 18
18 -
19
-
20
-
21
-
22
-
23
-
24
-
25
-
26
-
27
-
28
-
29
-
30
-
31
-
32
-
33
-
34
-
35
-
36
-
37
-
38
-
39
-
40
-
41
-
42
-
43
-
44
-
45
-
46
-
47
-
48
-
49
-
50
-
51
-
52
-
53
-
54
-
55
-
56
-
57
-
58
-
59
-
60
-
61
-
62
-
63
-
64
-
65
-
66
-
67
-
68
-
69
-
70
-
71
-
72
-
73
-
74
-
75
-
76
-
77
-
78
-
79
-
80
 |
 |
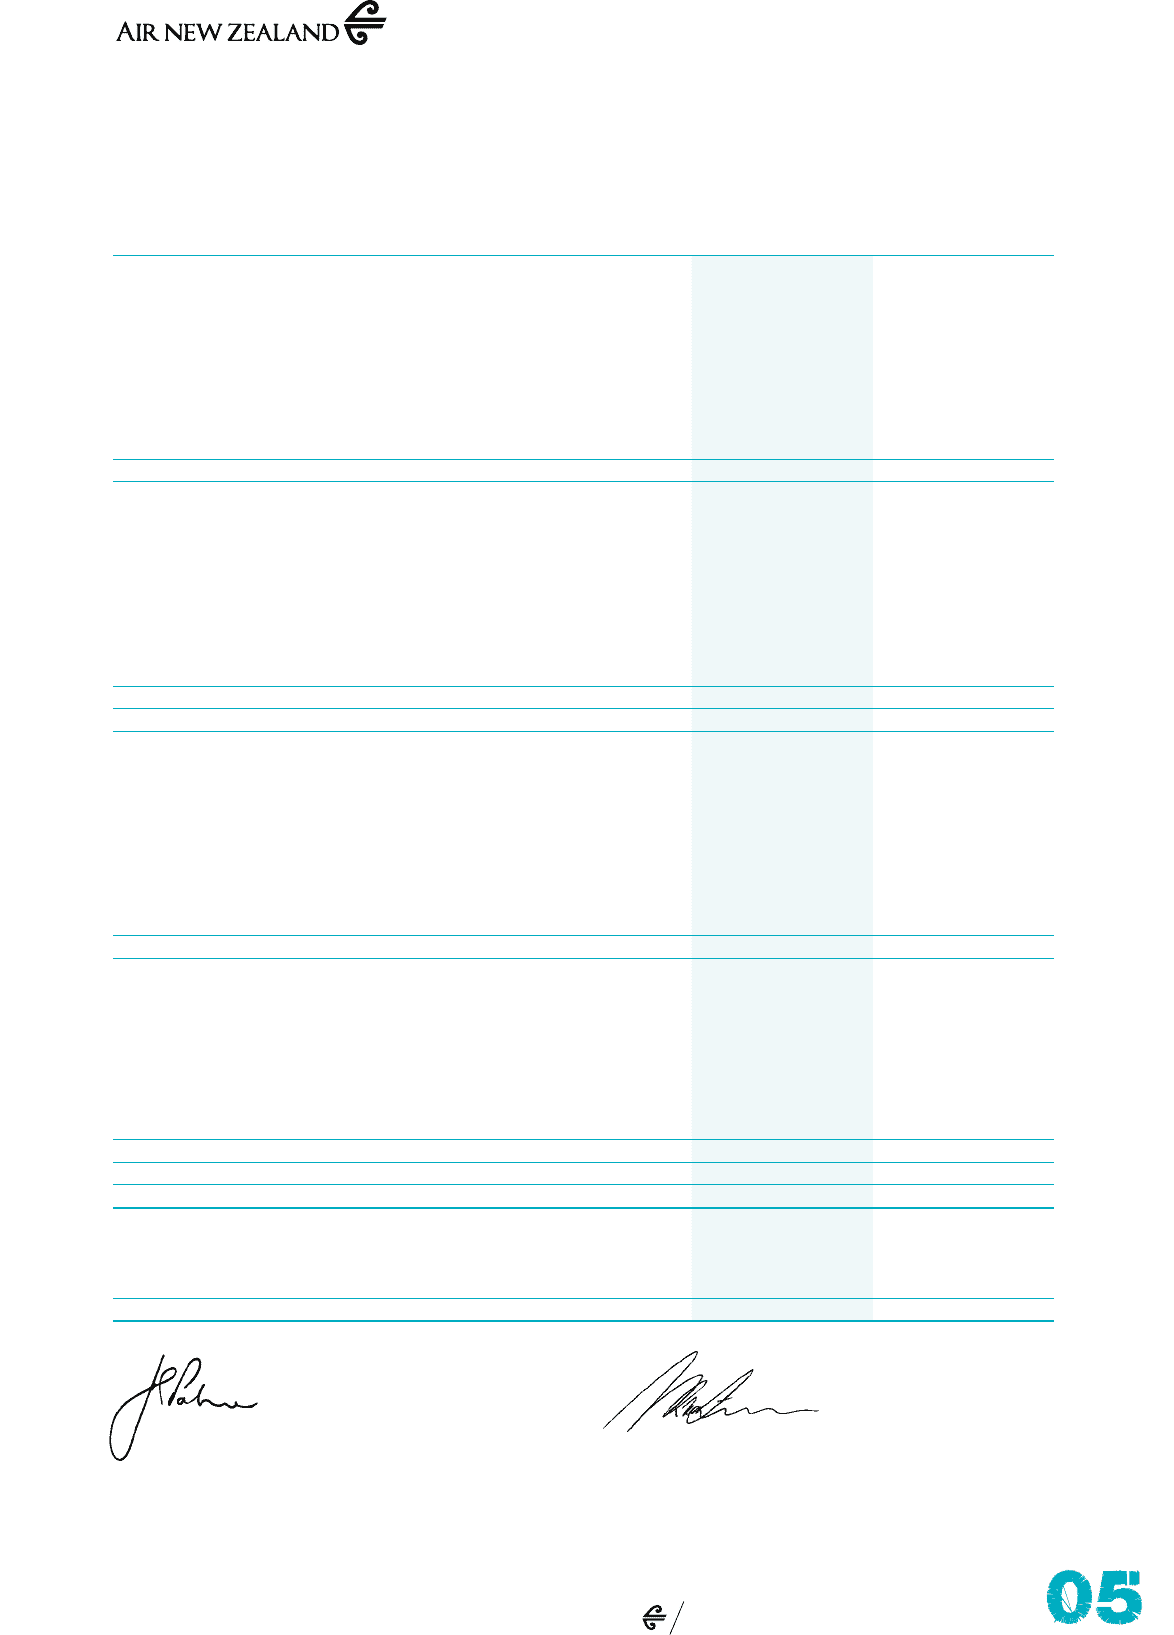
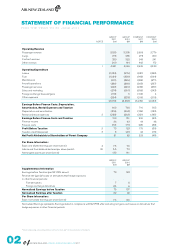
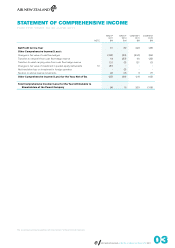
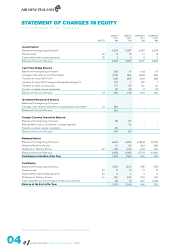
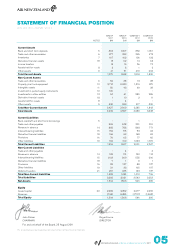
The accompanying accounting policies and notes form part of these financial statements.
NOTES
GROUP
2011
$M
GROUP
2010
$M
COMPANY
2011
$M
COMPANY
2010
$M
Current Assets
Bank and short term deposits 5 860 1,067 852 1,061
Trade and other receivables 6 377 322 326 274
Inventories 7 167 162 136 132
Derivative financial assets 18 13 62 14 63
Income taxation 14 16 56 70
Assets held for resale 8 3 8 1 2
Other assets 9 41 51 419 203
Total Current Assets 1,475 1,688 1,804 1,805
Non-Current Assets
Trade and other receivables 6 52 38 13 28
Property, plant and equipment 10 2,714 2,230 1,519 975
Intangible assets 11 56 43 49 38
Investment in quoted equity instruments 12 120 - - -
Investments in other entities 13 54 61 285 286
Derivative financial assets 18 1 10 2 11
Assets held for resale 8-4--
Other assets 9 430 523 417 505
Total Non-Current Assets 3,427 2,909 2,285 1,843
Total Assets 4,902 4,597 4,089 3,648
Current Liabilities
Bank overdraft and short term borrowings 5 - - 1 -
Trade and other payables 369 348 331 310
Revenue in advance 14 888 788 868 771
Interest-bearing liabilities 15 152 175 53 24
Derivative financial liabilities 18 166 62 168 62
Provisions 16 79 65 77 65
Other liabilities 19 162 169 1,033 1,315
Total Current Liabilities 1,816 1,607 2,531 2,547
Non-Current Liabilities
Trade and other payables - 4 - 4
Revenue in advance 14 122 114 122 114
Interest-bearing liabilities 15 1,103 900 555 206
Derivative financial liabilities 18 7 1 9 1
Provisions 16 88 137 88 137
Other liabilities 19 31 33 105 107
Deferred taxation 21 231 235 133 137
Total Non-Current Liabilities 1,582 1,424 1,012 706
Total Liabilities 3,398 3,031 3,543 3,253
Net Assets 1,504 1,566 546 395
Equity
Issued capital 22 2,269 2,252 2,277 2,260
Reserves (765) (686) (1,731) (1,865)
Total Equity 1,504 1,566 546 395
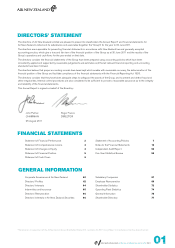
John Palmer Roger France
CHAIRMAN DIRECTOR
For and on behalf of the Board, 25 August 2011
AIR NEW ZEALAND ANNUAL FINANCIAL RESULTS 2011
STATEMENT OF FINANCIAL POSITION
AS AT 30 JUNE 2011