Air New Zealand 2011 Annual Report Download - page 40
Download and view the complete annual report
Please find page 40 of the 2011 Air New Zealand annual report below. You can navigate through the pages in the report by either clicking on the pages listed below, or by using the keyword search tool below to find specific information within the annual report.-
 1
1 -
2
-
3
-
4
-
5
-
6
-
7
-
8
-
9
-
10
-
11
-
12
-
13
-
14
-
15
-
16
-
17
-
18
-
19
-
20
-
21
-
22
-
23
-
24
-
25
-
26
-
27
-
28
-
29
-
 30
30 -
 31
31 -
 32
32 -
 33
33 -
 34
34 -
 35
35 -
 36
36 -
 37
37 -
 38
38 -
 39
39 -
 40
40 -
 41
41 -
 42
42 -
 43
43 -
 44
44 -
 45
45 -
 46
46 -
 47
47 -
 48
48 -
 49
49 -
 50
50 -
51
-
52
-
53
-
54
-
55
-
56
-
57
-
58
-
59
-
60
-
61
-
62
-
63
-
64
-
65
-
66
-
67
-
68
-
69
-
70
-
71
-
72
-
73
-
74
-
75
-
76
-
77
-
78
-
79
-
80
 |
 |

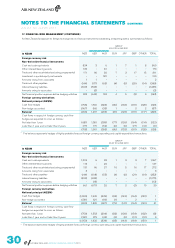
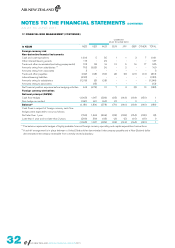
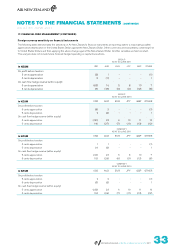
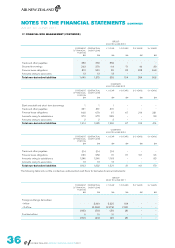
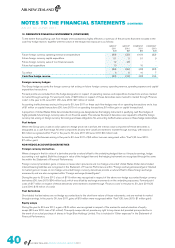
17. FINANCIAL RISK MANAGEMENT (CONTINUED)
GROUP
AS AT 30 JUNE 2011
NZ IFRS 9 CLASSIFICATION NZ IAS 39 CLASSIFICATION
AMORTISED
COST
$M
FAIR VALUE
P&L
NON-HEDGE
ACCOUNTED
$M
FAIR VALUE
OCI***
HEDGE
ACCOUNTED
$M
FAIR VALUE
OCI***
QUOTED
INVESTMENT
$M
LOANS AND
RECEIVABLES
$M
FAIR VALUE
P&L
NON-HEDGE
ACCOUNTED*
$M
FAIR VALUE
OCI***
HEDGE
ACCOUNTED
$M
QUOTED
INVESTMENT**
$M
Classification and fair values
Assets
Bank and short term deposits 860 - - - 860 - - -
Other interest-bearing assets 170 - - - 170 - - -
Trade and other receivables (excl. prepayments)
311 - - - 311 - - -
Investment in quoted equity instruments - - - 120 - - - 120
Derivative financial assets (Note 18) - 1 13 - - 1 13 -
Amounts owing from associates 2---2---
Total financial assets 1,343 1 13 120 1,343 1 13 120
* Classified as “held for trading” under NZ IAS 39.
** Long term strategic investment classified as “available for sale” under NZ IAS 39.
*** Recognised at fair value through other comprehensive income (OCI).
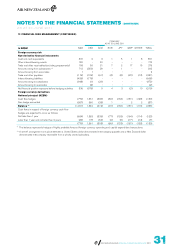
COMPANY
AS AT 30 JUNE 2011
NZ IFRS 9 CLASSIFICATION NZ IAS 39 CLASSIFICATION
AMORTISED
COST
$M
FAIR VALUE
P&L
NON-HEDGE
ACCOUNTED
$M
FAIR VALUE
OCI**
HEDGE
ACCOUNTED
$M
LOANS AND
RECEIVABLES
$M
FAIR VALUE
P&L
NON-HEDGE
ACCOUNTED*
$M
FAIR VALUE
OCI**
HEDGE
ACCOUNTED
$M
Classification and fair values
Assets
Bank and short term deposits 852 - - 852 - -
Other interest-bearing assets 170 - - 170 - -
Trade and other receivables (excl. prepayments)
279 - - 279 - -
Derivative financial assets (Note 18) - 1 15 - 1 15
Amounts owing from subsidiaries 392 - - 392 - -
Amounts owing from associates 2 - - 2 - -
Total financial assets 1,695 1 15 1,695 1 15
* Classified as “held for trading” under NZ IAS 39.
** Recognised at fair value through other comprehensive income (OCI).
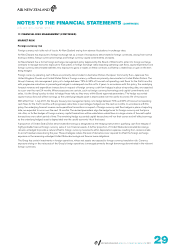
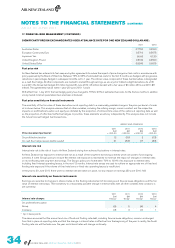
Capital risk management
The Group’s objectives when managing capital are to safeguard the company’s ability to continue as a going concern and to continue
to generate shareholder value and benefits for other stakeholders, and to provide an acceptable return for shareholders by removing
complexity, reducing costs and pricing our services commensurately with the level of risk. The Group is not subject to any externally
imposed capital requirements.
The Group’s capital structure is managed in the light of economic conditions and the risk characteristics of the underlying assets.
The Group’s capital structure may be modified by adjusting the amount of dividends paid to shareholders, initiating dividend reinvestment
opportunities, returning capital to shareholders, issuing new shares or selling assets to reduce debt. The capital management policies
and guidelines are regularly reviewed by the Board of Directors.
The Group monitors capital on the basis of gearing ratios. These ratios are calculated as net debt (both including and excluding
capitalised operating leases) over net debt plus equity. Net debt is calculated as total borrowings and finance lease obligations
(including net open derivatives on these instruments) less cash and cash equivalents and other interest-bearing assets. Capital
comprises all components of equity. These ratios and their calculation are disclosed in the Five Year Statistical Review.
NOTES TO THE FINANCIAL STATEMENTS (CONTINUED)
AS AT 30 JUNE 2011
AIR NEW ZEALAND ANNUAL FINANCIAL RESULTS 2011