Air New Zealand 2011 Annual Report Download - page 23
Download and view the complete annual report
Please find page 23 of the 2011 Air New Zealand annual report below. You can navigate through the pages in the report by either clicking on the pages listed below, or by using the keyword search tool below to find specific information within the annual report.-
 1
1 -
2
-
3
-
4
-
5
-
6
-
7
-
8
-
9
-
10
-
11
-
12
-
 13
13 -
 14
14 -
 15
15 -
 16
16 -
 17
17 -
 18
18 -
 19
19 -
 20
20 -
 21
21 -
 22
22 -
 23
23 -
 24
24 -
 25
25 -
 26
26 -
 27
27 -
 28
28 -
 29
29 -
 30
30 -
 31
31 -
 32
32 -
 33
33 -
34
-
35
-
36
-
37
-
38
-
39
-
40
-
41
-
42
-
43
-
44
-
45
-
46
-
47
-
48
-
49
-
50
-
51
-
52
-
53
-
54
-
55
-
56
-
57
-
58
-
59
-
60
-
61
-
62
-
63
-
64
-
65
-
66
-
67
-
68
-
69
-
70
-
71
-
72
-
73
-
74
-
75
-
76
-
77
-
78
-
79
-
80
 |
 |

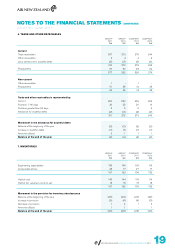
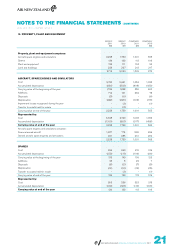
10. PROPERTY, PLANT AND EQUIPMENT
GROUP
2011
$M
GROUP
2010
$M
COMPANY
2011
$M
COMPANY
2010
$M
Property, plant and equipment comprises:
Aircraft, spare engines and simulators 2,228 1,759 1,091 555
Spares 136 133 112 109
Plant and equipment 122 111 104 94
Land and buildings 228 227 212 217
2,714 2,230 1,519 975
AIRCRAFT, SPARE ENGINES AND SIMULATORS
Cost 2,740 2,631 1,053 1,023
Accumulated depreciation (981) (803) (498) (423)
Carrying value at the beginning of the year 1,759 1,828 555 600
Additions 714 161 662 78
Disposals (3) (6) - (6)
Depreciation (242) (220) (126) (116)
Impairment losses recognised during the year - (1) - (1)
Transfer to assets held for resale - (3) - -
Carrying value at end of the year 2,228 1,759 1,091 555
Represented by:
Cost 3,328 2,740 1,608 1,053
Accumulated depreciation (1,100) (981) (517) (498)
Carrying value at end of the year 2,228 1,759 1,091 555
Aircraft, spare engines and simulators comprise:
Finance leased aircraft 1,307 774 830 256
Owned aircraft, spare engines and simulators 921 985 261 299
2,228 1,759 1,091 555
SPARES
Cost 256 260 215 219
Accumulated depreciation (123) (111) (106) (96)
Carrying value at the beginning of the year 133 149 109 123
Additions 25 8 22 7
Disposals (8) (5) (7) (5)
Depreciation (14) (18) (12) (15)
Transfer to assets held for resale - (1) - (1)
Carrying value at end of the year 136 133 112 109
Represented by:
Cost 265 256 222 215
Accumulated depreciation (129) (123) (110) (106)
Carrying value at end of the year 136 133 112 109
NOTES TO THE FINANCIAL STATEMENTS (CONTINUED)
AS AT 30 JUNE 2011
AIR NEW ZEALAND ANNUAL FINANCIAL RESULTS 2011