Air New Zealand 2011 Annual Report Download - page 21
Download and view the complete annual report
Please find page 21 of the 2011 Air New Zealand annual report below. You can navigate through the pages in the report by either clicking on the pages listed below, or by using the keyword search tool below to find specific information within the annual report.-
 1
1 -
2
-
3
-
4
-
5
-
6
-
7
-
8
-
9
-
10
-
 11
11 -
 12
12 -
 13
13 -
 14
14 -
 15
15 -
 16
16 -
 17
17 -
 18
18 -
 19
19 -
 20
20 -
 21
21 -
 22
22 -
 23
23 -
 24
24 -
 25
25 -
 26
26 -
 27
27 -
 28
28 -
 29
29 -
 30
30 -
 31
31 -
32
-
33
-
34
-
35
-
36
-
37
-
38
-
39
-
40
-
41
-
42
-
43
-
44
-
45
-
46
-
47
-
48
-
49
-
50
-
51
-
52
-
53
-
54
-
55
-
56
-
57
-
58
-
59
-
60
-
61
-
62
-
63
-
64
-
65
-
66
-
67
-
68
-
69
-
70
-
71
-
72
-
73
-
74
-
75
-
76
-
77
-
78
-
79
-
80
 |
 |
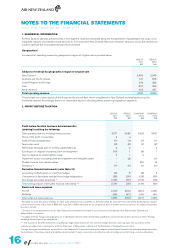
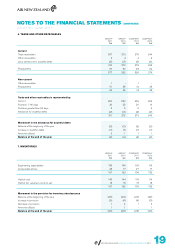
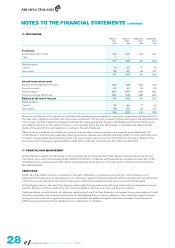
6. TRADE AND OTHER RECEIVABLES
GROUP
2011
$M
GROUP
2010
$M
COMPANY
2011
$M
COMPANY
2010
$M
Current
Trade receivables 307 272 276 244
Other receivables 5 3 4 3
Less: allowance for doubtful debts (2) (3) (2) (2)
310 272 278 245
Prepayments 67 50 48 29
377 322 326 274
Non-current
Other receivables 1 - 1 -
Prepayments 51 38 12 28
52 38 13 28
Trade and other receivables is represented by:
Current 280 250 259 229
Past due 1- 90 days 30 22 20 16
Past due greater than 90 days 3 3 2 2
Allowance for doubtful debts (2) (3) (2) (2)
311 272 279 245
Movement in the allowance for doubtful debts
Balance at the beginning of the year (3) (3) (2) (2)
Increase in doubtful debts (1) (1) (1) (1)
Amounts utilised 2 1 1 1
Balance at the end of the year (2) (3) (2) (2)
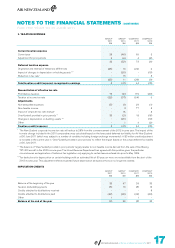
7. INVENTORIES
GROUP
2011
$M
GROUP
2010
$M
COMPANY
2011
$M
COMPANY
2010
$M
Engineering expendables 139 145 109 115
Consumable stores 28 17 27 17
167 162 136 132
Held at cost 149 144 118 114
Held at fair value less costs to sell 18 18 18 18
167 162 136 132
Movement in the provision for inventory obsolescence
Balance at the beginning of the year (23) (24) (20) (22)
Increase in provision (5) (4) (4) (3)
Decrease in provision 1 4 1 4
Amounts utilised 1 1 - 1
Balance at the end of the year (26) (23) (23) (20)
NOTES TO THE FINANCIAL STATEMENTS (CONTINUED)
AS AT 30 JUNE 2011
AIR NEW ZEALAND ANNUAL FINANCIAL RESULTS 2011