Air New Zealand 2011 Annual Report Download - page 20
Download and view the complete annual report
Please find page 20 of the 2011 Air New Zealand annual report below. You can navigate through the pages in the report by either clicking on the pages listed below, or by using the keyword search tool below to find specific information within the annual report.-
 1
1 -
2
-
3
-
4
-
5
-
6
-
7
-
8
-
9
-
 10
10 -
 11
11 -
 12
12 -
 13
13 -
 14
14 -
 15
15 -
 16
16 -
 17
17 -
 18
18 -
 19
19 -
 20
20 -
 21
21 -
 22
22 -
 23
23 -
 24
24 -
 25
25 -
 26
26 -
 27
27 -
 28
28 -
 29
29 -
 30
30 -
31
-
32
-
33
-
34
-
35
-
36
-
37
-
38
-
39
-
40
-
41
-
42
-
43
-
44
-
45
-
46
-
47
-
48
-
49
-
50
-
51
-
52
-
53
-
54
-
55
-
56
-
57
-
58
-
59
-
60
-
61
-
62
-
63
-
64
-
65
-
66
-
67
-
68
-
69
-
70
-
71
-
72
-
73
-
74
-
75
-
76
-
77
-
78
-
79
-
80
 |
 |
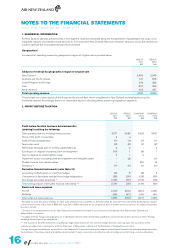
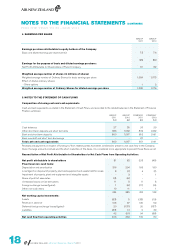
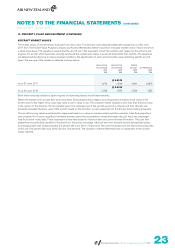
4. EARNINGS PER SHARE
GROUP
2011
GROUP
2010
Earnings per share attributable to equity holders of the Company
Basic and diluted earnings per share (cents) 7.5 7.6
$M $M
Earnings for the purpose of basic and diluted earnings per share:
Net Profit Attributable to Shareholders of Parent Company 81 82
Weighted average number of shares (in millions of shares)
Weighted average number of Ordinary Shares for basic earnings per share 1,084 1,073
Effect of dilutive ordinary shares:
- Share options 1 3
Weighted average number of Ordinary Shares for diluted earnings per share 1,085 1,076
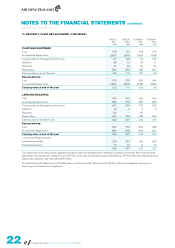
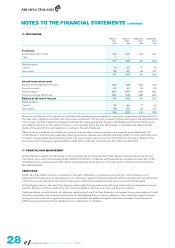
5. NOTES TO THE STATEMENT OF CASH FLOWS
Composition of closing cash and cash equivalents
Cash and cash equivalents, as stated in the Statement of Cash Flows, are reconciled to the related balances in the Statement of Financial
Position as follows:
GROUP
2011
$M
GROUP
2010
$M
COMPANY
2011
$M
COMPANY
2010
$M
Cash balances 27 35 20 29
Other short term deposits and short term bills 833 1,032 832 1,032
Bank and short term deposits 860 1,067 852 1,061
Bank overdraft and short term borrowings - - (1) -
Total cash and cash equivalents 860 1,067 851 1,061
Receipts and payments in respect of funding to/from related parties have been combined to present a net cash flow in the Company.
Given the large amounts involved and the short maturities of the deals, it is considered more appropriate to present these flows as net.
Reconciliation of Net Profit Attributable to Shareholders to Net Cash Flows from Operating Activities:
Net profit attributable to shareholders 81 82 223 (45)
Plus/(less) non-cash items:
Depreciation and amortisation 316 294 189 180
Loss/(gain) on disposal of property, plant and equipment and assets held for resale 8 (1) 6 (1)
Impairment of property, plant and equipment and intangible assets - 3 - 1
Share of profit of associates (3) (6) - -
Unrealised losses on fuel derivatives 11 8 11 8
Foreign exchange losses/(gains) 1 (6) (11) (6)
Other non-cash items 10 11 - 1
424 385 418 138
Net working capital movements:
Assets (53) 5 (33) (19)
Revenue in advance 108 67 105 59
Deferred foreign exchange losses/(gains) 20 (137) 20 (137)
Liabilities (33) 14 2 39
42 (51) 94 (58)
Net cash flow from operating activities 466 334 512 80
NOTES TO THE FINANCIAL STATEMENTS (CONTINUED)
FOR THE YEAR TO 30 JUNE 2011
AIR NEW ZEALAND ANNUAL FINANCIAL RESULTS 2011