Air New Zealand 2011 Annual Report Download - page 4
Download and view the complete annual report
Please find page 4 of the 2011 Air New Zealand annual report below. You can navigate through the pages in the report by either clicking on the pages listed below, or by using the keyword search tool below to find specific information within the annual report.-
 1
1 -
 2
2 -
 3
3 -
 4
4 -
 5
5 -
 6
6 -
 7
7 -
 8
8 -
 9
9 -
 10
10 -
 11
11 -
 12
12 -
 13
13 -
 14
14 -
 15
15 -
16
-
17
-
18
-
19
-
20
-
21
-
22
-
23
-
24
-
25
-
26
-
27
-
28
-
29
-
30
-
31
-
32
-
33
-
34
-
35
-
36
-
37
-
38
-
39
-
40
-
41
-
42
-
43
-
44
-
45
-
46
-
47
-
48
-
49
-
50
-
51
-
52
-
53
-
54
-
55
-
56
-
57
-
58
-
59
-
60
-
61
-
62
-
63
-
64
-
65
-
66
-
67
-
68
-
69
-
70
-
71
-
72
-
73
-
74
-
75
-
76
-
77
-
78
-
79
-
80
 |
 |

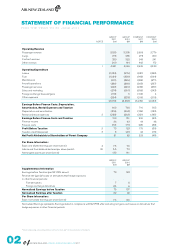
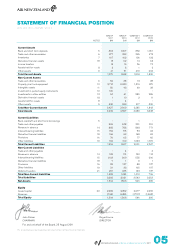
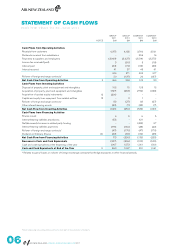
The accompanying accounting policies and notes form part of these financial statements.
NOTES
GROUP
2011
$M
GROUP
2010
$M
COMPANY
2011
$M
COMPANY
2010
$M
Operating Revenue
Passenger revenue 3,525 3,305 2,986 2,776
Cargo 278 255 273 250
Contract services 329 322 248 241
Other revenue 209 164 442 172
1 4,341 4,046 3,949 3,439
Operating Expenditure
Labour (1,034) (976) (881) (822)
Fuel (1,084) (939) (993) (864)
Maintenance (311) (326) (252) (271)
Aircraft operations (381) (369) (305) (297)
Passenger services (242) (240) (232) (231)
Sales and marketing (274) (261) (256) (243)
Foreign exchange (losses)/gains (118) 6 (104) 4
Other expenses (234) (233) (216) (210)
(3,678) (3,338) (3,239) (2,934)
Earnings Before Finance Costs, Depreciation,
Amortisation, Rental Expenses and Taxation 663 708 710 505
Depreciation and amortisation (316) (294) (189) (180)
Rental and lease expenses 2 (238) (263) (321) (345)
Earnings Before Finance Costs and Taxation 109 151 200 (20)
Finance income 36 43 44 48
Finance costs (72) (71) (65) (58)
Profit Before Taxation 2 73 123 179 (30)
Taxation credit/(expense) 3 8 (41) 44 (15)
Net Profit Attributable to Shareholders of Parent Company 81 82 223 (45)
Per Share Information:
Basic and diluted earnings per share (cents) 4 7.5 7.6
Interim and final dividend declared per share (cents) 20 5.5 7.0
Net tangible assets per share (cents) 133 141
GROUP
2011
$M
GROUP
2010
$M
Supplementary Information
Earnings before Taxation (per NZ IFRS above) 73 123
Reverse net (gains)/losses on derivatives that hedge exposures
in other financial periods:
Fuel derivatives 7 8
Foreign exchange derivatives (5) 6
Normalised Earnings before Taxation 75 137
Normalised Earnings after Taxation 82 92
Per Share Information:
Basic normalised earnings per share (cents) 7.6 8.6
Normalised Earnings represents Earnings stated in compliance with NZ IFRS after excluding net gains and losses on derivatives that
hedge exposures in other financial periods.
AIR NEW ZEALAND ANNUAL FINANCIAL RESULTS 2011
STATEMENT OF FINANCIAL PERFORMANCE
FOR THE YEAR TO 30 JUNE 2011