Air New Zealand 2011 Annual Report Download - page 58
Download and view the complete annual report
Please find page 58 of the 2011 Air New Zealand annual report below. You can navigate through the pages in the report by either clicking on the pages listed below, or by using the keyword search tool below to find specific information within the annual report.-
 1
1 -
2
-
3
-
4
-
5
-
6
-
7
-
8
-
9
-
10
-
11
-
12
-
13
-
14
-
15
-
16
-
17
-
18
-
19
-
20
-
21
-
22
-
23
-
24
-
25
-
26
-
27
-
28
-
29
-
30
-
31
-
32
-
33
-
34
-
35
-
36
-
37
-
38
-
39
-
40
-
41
-
42
-
43
-
44
-
45
-
46
-
47
-
 48
48 -
 49
49 -
 50
50 -
 51
51 -
 52
52 -
 53
53 -
 54
54 -
 55
55 -
 56
56 -
 57
57 -
 58
58 -
 59
59 -
 60
60 -
 61
61 -
 62
62 -
 63
63 -
 64
64 -
 65
65 -
 66
66 -
 67
67 -
 68
68 -
69
-
70
-
71
-
72
-
73
-
74
-
75
-
76
-
77
-
78
-
79
-
80
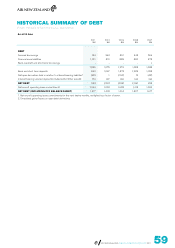
 |
 |

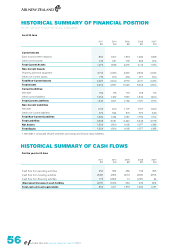
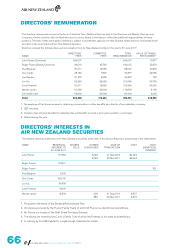
As at 30 June
2011
$M
2010
$M
2009
$M
2008
$M
2007
$M
Current Assets
Bank and short term deposits 860 1,067 1,573 1,289 1,058
Other current assets 615 621 702 823 672
Total Current Assets 1,475 1,688 2,275 2,112 1,730
Non-Current Assets
Property, plant and equipment 2,714 2,230 2,337 2,534 2,636
Other non-current assets 713 679 433 377 300
Total Non-Current Assets 3,427 2,909 2,770 2,911 2,936
Total Assets 4,902 4,597 5,045 5,023 4,666
Current Liabilities
Net debt1152 175 172 158 116
Other current liabilities 1,664 1,432 1,587 1,549 1,460
Total Current Liabilities 1,816 1,607 1,759 1,707 1,576
Non-Current Liabilities
Net debt11,103 900 1,107 1,167 1,269
Other non-current liabilities 479 524 574 572 433
Total Non-Current Liabilities 1,582 1,424 1,681 1,739 1,702
Total Liabilities 3,398 3,031 3,440 3,446 3,278
Net Assets 1,504 1,566 1,605 1,577 1,388
Total Equity 1,504 1,566 1,605 1,577 1,388
1. Net debt is comprised of bank overdraft, borrowings and finance lease liabilities.
HISTORICAL SUMMARY OF CASH FLOWS
For the year to 30 June
2011
$M
2010
$M
2009
$M
2008
$M
2007
$M
Cash flow from operating activities 466 334 486 743 455
Cash flow from investing activities (846) (450) (216) (290) (572)
Cash flow from financing activities 173 (390) 14 (221) 24
(Decrease)/increase in cash holding (207) (506) 284 232 (93)
Total cash and cash equivalents 860 1,067 1,573 1,289 1,057
HISTORICAL SUMMARY OF FINANCIAL POSITION
FIVE YEAR STATISTICAL REVIEW
AIR NEW ZEALAND ANNUAL FINANCIAL RESULTS 2011