Air New Zealand 2008 Annual Report Download - page 6
Download and view the complete annual report
Please find page 6 of the 2008 Air New Zealand annual report below. You can navigate through the pages in the report by either clicking on the pages listed below, or by using the keyword search tool below to find specific information within the annual report.-
 1
1 -
 2
2 -
 3
3 -
 4
4 -
 5
5 -
 6
6 -
 7
7 -
 8
8 -
 9
9 -
 10
10 -
 11
11 -
 12
12 -
 13
13 -
 14
14 -
 15
15 -
 16
16 -
 17
17 -
18
-
19
-
20
-
21
-
22
-
23
-
24
-
25
-
26
-
27
-
28
-
29
-
30
-
31
-
32
-
33
-
34
-
35
-
36
-
37
-
38
-
39
-
40
-
41
-
42
-
43
-
44
-
45
-
46
-
47
-
48
-
49
-
50
-
51
-
52
-
53
-
54
-
55
-
56
-
57
-
58
-
59
-
60
-
61
-
62
-
63
-
64
-
65
-
66
-
67
-
68
-
69
-
70
-
71
-
72
-
73
-
74
-
75
-
76
 |
 |

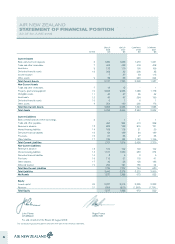
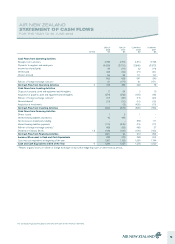
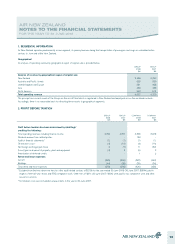
The accompanying accounting policies and notes form part of these financial statements.
AIR NEW ZEALAND
STATEMENT OF FINANCIAL POSITION
AS AT 30 JUNE 2008
NOTES
GROUP
2008
$M
GROUP
2007
$M
COMPANY
2008
$M
COMPANY
2007
$M
Current Assets
Bank and short term deposits 6 1,289 1,058 1,279 1,051
Trade and other receivables 7 462 448 418 408
Inventories 8 123 119 109 106
Derivative financial assets 16 208 35 208 35
Income taxation 7 37 33 113
Other assets 9 38 33 246 224
Total Current Assets 2,127 1,730 2,293 1,937
Non-Current Assets
Trade and other receivables 7 13 15 - 1
Property, plant and equipment 10 2,534 2,636 1,088 1,178
Intangible assets 11 40 47 35 42
Investments 12 49 47 284 190
Derivative financial assets 16 6 1 6 1
Other assets 9 254 190 236 173
Total Non-Current Assets 2,896 2,936 1,649 1,585
Total Assets 5,023 4,666 3,942 3,522
Current Liabilities
Bank overdraft and short term borrowings 6 - 1 1 1
Trade and other payables 480 384 419 328
Revenue in advance 13 822 748 815 721
Interest-bearing liabilities 14 158 115 21 20
Derivative financial liabilities 16 84 139 84 139
Provisions 15 27 55 27 55
Other liabilities 17 136 134 1,159 1,106
Total Current Liabilities 1,707 1,576 2,526 2,370
Non-Current Liabilities
Revenue in advance 13 109 102 109 102
Interest-bearing liabilities 14 1,167 1,269 253 274
Derivative financial liabilities 16 3 6 3 6
Provisions 15 116 91 115 91
Other liabilities 17 45 53 128 133
Deferred taxation 19 299 181 136 24
Total Non-Current Liabilities 1,739 1,702 744 630
Total Liabilities 3,446 3,278 3,270 3,000
Net Assets 1,577 1,388 672 522
Equity
Issued capital 20 2,227 2,215 2,235 2,223
Reserves 21 (650) (827) (1,563) (1,701)
Total Equity 1,577 1,388 672 522
John Palmer Roger France
CHAIRMAN DIRECTOR
For and on behalf of the Board, 26 August 2008
4