Air New Zealand 2008 Annual Report Download - page 28
Download and view the complete annual report
Please find page 28 of the 2008 Air New Zealand annual report below. You can navigate through the pages in the report by either clicking on the pages listed below, or by using the keyword search tool below to find specific information within the annual report.-
 1
1 -
2
-
3
-
4
-
5
-
6
-
7
-
8
-
9
-
10
-
11
-
12
-
13
-
14
-
15
-
16
-
17
-
 18
18 -
 19
19 -
 20
20 -
 21
21 -
 22
22 -
 23
23 -
 24
24 -
 25
25 -
 26
26 -
 27
27 -
 28
28 -
 29
29 -
 30
30 -
 31
31 -
 32
32 -
 33
33 -
 34
34 -
 35
35 -
 36
36 -
 37
37 -
 38
38 -
39
-
40
-
41
-
42
-
43
-
44
-
45
-
46
-
47
-
48
-
49
-
50
-
51
-
52
-
53
-
54
-
55
-
56
-
57
-
58
-
59
-
60
-
61
-
62
-
63
-
64
-
65
-
66
-
67
-
68
-
69
-
70
-
71
-
72
-
73
-
74
-
75
-
76
 |
 |
AIR NEW ZEALAND
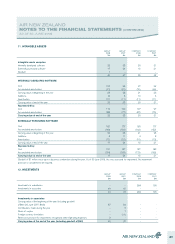
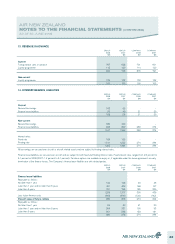
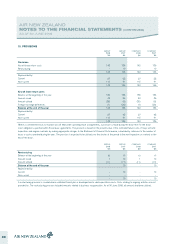
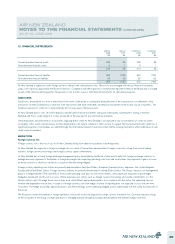
NOTES TO THE FINANCIAL STATEMENTS (CONTINUED)
AS AT 30 JUNE 2008
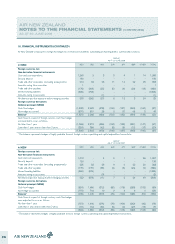
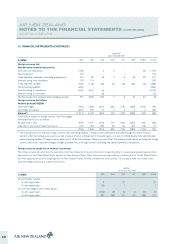
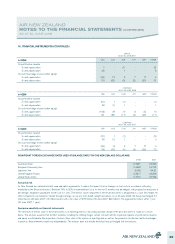
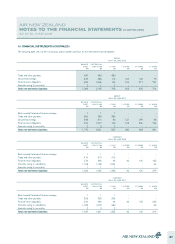
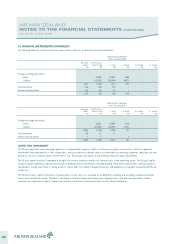
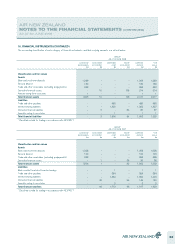
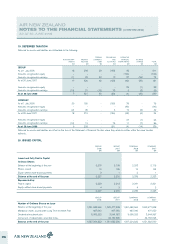
16. FINANCIAL INSTRUMENTS (CONTINUED)
Air New Zealand’s exposure to foreign exchange risk on financial instruments outstanding at reporting date is summarised as follows:
GROUP
AS AT 30 JUNE 2008
In NZ$M NZD USD AUD EUR JPY GBP OTHER TOTAL
Foreign currency risk
Non-derivative financial instruments
Cash and cash equivalents 1,263 2 3 2 4 1 14 1,289
Security deposit 130 - - - - - - 130
Trade and other receivables (excluding prepayments) 219 68 26 11 14 22 23 383
Amounts owing from associates 1 - - - - - - 1
Trade and other payables (178) (203) (55) (5) (6) (20) (13) (480)
Interest-bearing liabilities (532) (793) - - - - - (1,325)
Amounts owing to associates - - (1) - - - - (1)
Net financial position exposure before hedging activities 903 (926) (27) 8 12 3 24 (3)
Foreign currency derivatives
Notional principal (NZ$M)
Cash flow hedges (1,392) 2,603 (478) (160) (137) (363) (160) (87)
Non-hedge accounted (870) 891 25 2 (7) (4) 3 40
Balance* (1,359) 2,568 (480) (150) (132) (364) (133) (50)
Cash flows in respect of foreign currency cash flow hedges
are expected to occur as follows:
Not later than 1 year (1,068) 2,219 (436) (152) (132) (351) (147) (67)
Later than 1 year and not later than 2 years (324) 384 (42) (8) (5) (12) (13) (20)
(1,392) 2,603 (478) (160) (137) (363) (160) (87)
* The balance represents hedges of highly probable forecast foreign currency operating and capital expenditure transactions.
GROUP
AS AT 30 JUNE 2007
In NZ$M NZD USD AUD EUR JPY GBP OTHER TOTAL
Foreign currency risk
Non-derivative financial instruments
Cash and cash equivalents 1,012 - 4 2 1 - 38 1,057
Security deposit 120 - - - - - - 120
Trade and other receivables (excluding prepayments) 225 83 23 9 6 22 20 388
Trade and other payables (170) (137) (35) (4) (5) (24) (9) (384)
Interest-bearing liabilities (565) (819) - - - - - (1,384)
Amounts owing to associates - - (3) - - - - (3)
Net financial position exposure before hedging activities 622 (873) (11) 7 2 (2) 49 (206)
Foreign currency derivatives
Notional principal (NZ$M)
Cash flow hedges (824) 1,650 (312) (85) (115) (289) (105) (80)
Non-hedge accounted (797) 718 10 2 4 6 4 (53)
Balance* (999) 1,495 (313) (76) (109) (285) (52) (339)
Cash flows in respect of foreign currency cash flow hedges
were expected to occur as follows:
Not later than 1 year (757) 1,496 (276) (76) (106) (262) (92) (73)
Later than 1 year and not later than 2 years (67) 154 (36) (9) (9) (27) (13) (7)
(824) 1,650 (312) (85) (115) (289) (105) (80)
* The balance represents hedges of highly probable forecast foreign currency operating and capital expenditure transactions.
26