Air New Zealand 2008 Annual Report Download - page 54
Download and view the complete annual report
Please find page 54 of the 2008 Air New Zealand annual report below. You can navigate through the pages in the report by either clicking on the pages listed below, or by using the keyword search tool below to find specific information within the annual report.-
 1
1 -
2
-
3
-
4
-
5
-
6
-
7
-
8
-
9
-
10
-
11
-
12
-
13
-
14
-
15
-
16
-
17
-
18
-
19
-
20
-
21
-
22
-
23
-
24
-
25
-
26
-
27
-
28
-
29
-
30
-
31
-
32
-
33
-
34
-
35
-
36
-
37
-
38
-
39
-
40
-
41
-
42
-
43
-
 44
44 -
 45
45 -
 46
46 -
 47
47 -
 48
48 -
 49
49 -
 50
50 -
 51
51 -
 52
52 -
 53
53 -
 54
54 -
 55
55 -
 56
56 -
 57
57 -
 58
58 -
 59
59 -
 60
60 -
 61
61 -
 62
62 -
 63
63 -
 64
64 -
65
-
66
-
67
-
68
-
69
-
70
-
71
-
72
-
73
-
74
-
75
-
76
 |
 |
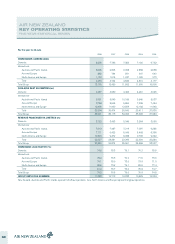
As at 30 June
2008
$M
2007
$M
2006
$M
2005
$M
2004
$M
Current Assets
Bank and short term deposits 1,289 1,058 1,150 1,071 1,022
Other current assets 838 672 571 561 578
Total Current Assets 2,127 1,730 1,721 1,632 1,600
Non-Current Assets
Property, plant and equipment 2,534 2,636 2,669 2,012 2,062
Other non-current assets 362 300 395 448 156
Total Non-Current Assets 2,896 2,936 3,064 2,460 2,218
Total Assets 5,023 4,666 4,785 4,092 3,818
Current Liabilities
Net debt1158 116 345 84 99
Other current liabilities 1,549 1,460 1,236 1,136 1,021
Total Current Liabilities 1,707 1,576 1,581 1,220 1,120
Non-Current Liabilities
Net debt11,167 1,269 1,113 809 885
Other non-current liabilities 572 433 497 522 598
Total Non-Current Liabilities 1,739 1,702 1,610 1,331 1,483
Total Liabilities 3,446 3,278 3,191 2,551 2,603
Net Assets 1,577 1,388 1,594 1,541 1,215
Total Equity 1,577 1,388 1,594 1,541 1,215
1. Net debt is comprised of bank overdraft, borrowings, finance lease liabilities and convertible notes.
HISTORICAL SUMMARY OF CASH FLOWS
For the year to 30 June
2008
$M
2007
$M
2006
$M
2005
$M
2004
$M
Cash flow from operating activities 743 455 473 437 467
Cash flow from investing activities (290) (572) (772) (532) (171)
Cash flow from financing activities (221) 24 379 145 (42)
Increase/(decrease) in cash holding 232 (93) 80 50 254
Total cash held 1,289 1,057 1,150 1,070 1,020
The Group adopted NZ IFRS on 1 July 2007. Only information from 2007 onwards is compliant with NZ IFRS. In accordance with exemptions available
under NZ IFRS 1, all previous information is compliant with previous GAAP. The nature of the adjustments which would make this information compliant
with NZ IFRS is provided within note 28.
AIR NEW ZEALAND
HISTORICAL SUMMARY OF FINANCIAL POSITION
FIVE YEAR STATISTICAL REVIEW
52