Air New Zealand 2008 Annual Report Download - page 21
Download and view the complete annual report
Please find page 21 of the 2008 Air New Zealand annual report below. You can navigate through the pages in the report by either clicking on the pages listed below, or by using the keyword search tool below to find specific information within the annual report.-
 1
1 -
2
-
3
-
4
-
5
-
6
-
7
-
8
-
9
-
10
-
 11
11 -
 12
12 -
 13
13 -
 14
14 -
 15
15 -
 16
16 -
 17
17 -
 18
18 -
 19
19 -
 20
20 -
 21
21 -
 22
22 -
 23
23 -
 24
24 -
 25
25 -
 26
26 -
 27
27 -
 28
28 -
 29
29 -
 30
30 -
 31
31 -
32
-
33
-
34
-
35
-
36
-
37
-
38
-
39
-
40
-
41
-
42
-
43
-
44
-
45
-
46
-
47
-
48
-
49
-
50
-
51
-
52
-
53
-
54
-
55
-
56
-
57
-
58
-
59
-
60
-
61
-
62
-
63
-
64
-
65
-
66
-
67
-
68
-
69
-
70
-
71
-
72
-
73
-
74
-
75
-
76
 |
 |
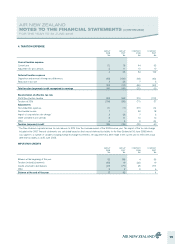
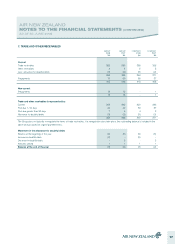
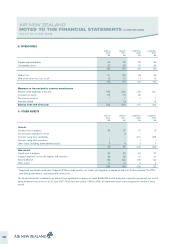
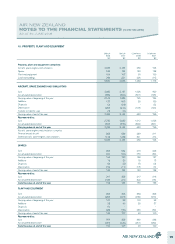
AIR NEW ZEALAND
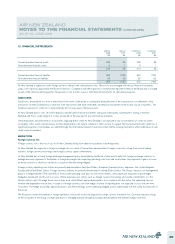
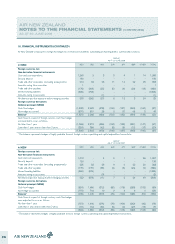
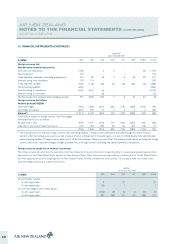
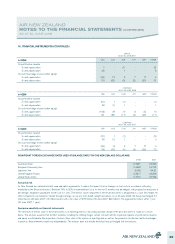
NOTES TO THE FINANCIAL STATEMENTS (CONTINUED)
AS AT 30 JUNE 2008
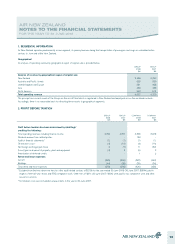
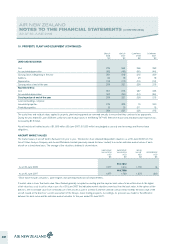
10. PROPERTY, PLANT AND EQUIPMENT
GROUP
2008
$M
GROUP
2007
$M
COMPANY
2008
$M
COMPANY
2007
$M
Property, plant and equipment comprises:
Aircraft, spare engines and simulators 2,036 2,144 630 725
Spares 158 164 133 138
Plant and equipment 106 107 99 100
Land and buildings 234 221 226 215
2,534 2,636 1,088 1,178
AIRCRAFT, SPARE ENGINES AND SIMULATORS
Cost 2,682 2,197 1,026 920
Accumulated depreciation (538) (362) (301) (196)
Carrying value at beginning of the year 2,144 1,835 725 724
Additions 137 609 28 126
Disposals (2) (54) - (5)
Depreciation (239) (244) (123) (120)
Transfer to held for sale (4) (2) - -
Carrying value at end of the year 2,036 2,144 630 725
Represented by:
Cost 2,735 2,682 1,012 1,026
Accumulated depreciation (699) (538) (382) (301)
Carrying value at end of the year 2,036 2,144 630 725
Aircraft, spare engines and simulators comprise:
Finance leased aircraft 888 886 289 311
Owned aircraft, spare engines and simulators 1,148 1,258 341 414
2,036 2,144 630 725
SPARES
Cost 255 244 213 206
Accumulated depreciation (91) (84) (75) (69)
Carrying value at beginning of the year 164 160 138 137
Additions 18 20 15 13
Disposals (8) (5) (7) (3)
Depreciation (16) (11) (13) (9)
Carrying value at end of the year 158 164 133 138
Represented by:
Cost 261 255 217 213
Accumulated depreciation (103) (91) (84) (75)
Carrying value at end of the year 158 164 133 138
PLANT AND EQUIPMENT
Cost 356 326 338 308
Accumulated depreciation (249) (227) (238) (215)
Carrying value at beginning of the year 107 99 100 93
Additions 28 40 25 37
Disposals (1) - - -
Depreciation (28) (32) (26) (30)
Carrying value at end of the year 106 107 99 100
Represented by:
Cost 379 356 360 338
Accumulated depreciation (273) (249) (261) (238)
Carrying value at end of the year 106 107 99 100
19