3M 2014 Annual Report Download - page 94
Download and view the complete annual report
Please find page 94 of the 2014 3M annual report below. You can navigate through the pages in the report by either clicking on the pages listed below, or by using the keyword search tool below to find specific information within the annual report.-
 1
1 -
2
-
3
-
4
-
5
-
6
-
7
-
8
-
9
-
10
-
11
-
12
-
13
-
14
-
15
-
16
-
17
-
18
-
19
-
20
-
21
-
22
-
23
-
24
-
25
-
26
-
27
-
28
-
29
-
30
-
31
-
32
-
33
-
34
-
35
-
36
-
37
-
38
-
39
-
40
-
41
-
42
-
43
-
44
-
45
-
46
-
47
-
48
-
49
-
50
-
51
-
52
-
53
-
54
-
55
-
56
-
57
-
58
-
59
-
60
-
61
-
62
-
63
-
64
-
65
-
66
-
67
-
68
-
69
-
70
-
71
-
72
-
73
-
74
-
75
-
76
-
77
-
78
-
79
-
80
-
81
-
82
-
83
-
 84
84 -
 85
85 -
 86
86 -
 87
87 -
 88
88 -
 89
89 -
 90
90 -
 91
91 -
 92
92 -
 93
93 -
 94
94 -
 95
95 -
 96
96 -
 97
97 -
 98
98 -
 99
99 -
 100
100 -
 101
101 -
 102
102 -
 103
103 -
 104
104 -
105
-
106
-
107
-
108
-
109
-
110
-
111
-
112
-
113
-
114
-
115
-
116
-
117
-
118
-
119
-
120
-
121
-
122
-
123
-
124
-
125
-
126
-
127
-
128
-
129
-
130
-
131
-
132
 |
 |

88
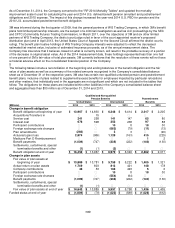
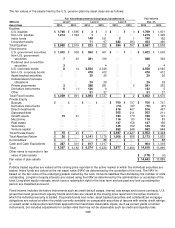
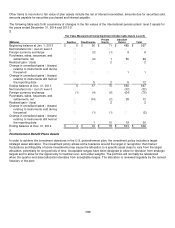
The fair values of the assets held by the postretirement benefit plans by asset class are as follows:
Fair Value Measurements Using Inputs Considered as
Fair Value at
(Millions)
Level 1
Level 2
Level 3
Dec. 31,
Asset Class
2014
2013
2014
2013
2014
2013
2014
2013
Equities
U.S. equities
$
565
$ 552
$
―
$ ―
$
―
$ ―
$
565
$
552
Non-U.S. equities
56
58
―
―
―
―
56
58
Index funds
―
―
38
44
―
―
38
44
Long/short equity
―
―
3
―
14
16
17
16
Total Equities
$
621
$ 610
$
41
$ 44
$
14
$
16
$
676
$
670
Fixed Income
U.S. government securities
$
68
$ 62
$
186
$ 202
$
―
$ ―
$
254
$
264
Non-U.S. government
securities
―
1
17
14
―
―
17
15
U.S. corporate bonds
―
―
119
96
―
―
119
96
Non-U.S. corporate bonds
―
―
24
21
―
―
24
21
Asset-backed securities
―
―
7
9
―
―
7
9
Collateralized mortgage
obligations
―
―
5
5
―
―
5
5
Private placements
―
―
25
16
―
―
25
16
Derivative instruments
―
―
5
―
―
―
5
―
Other
―
―
1
1
―
―
1
1
Total Fixed Income
$
68
$ 63
$
389
$ 364
$
―
$
―
$
457
$
427
Private Equity
Buyouts
$
―
$ ―
$
―
$ ―
$
56
$ 58
$
56
$
58
Derivative instruments
―
―
―
―
(3)
(3)
(3)
(3)
Direct investments
―
―
―
―
19
16
19
16
Distressed debt
―
―
―
―
8
7
8
7
Growth equity
1
1
―
―
7
6
8
7
Mezzanine
―
―
―
―
4
3
4
3
Real estate
―
―
―
―
5
5
5
5
Secondary
―
―
―
―
5
5
5
5
Venture capital
―
―
―
―
58
64
58
64
Total Private Equity
$
1
$ 1
$
―
$ ―
$
159
$
161
$
160
$
162
Total Absolute Return
$
1
$ ―
$
41
$ 37
$
37
$
26
$
79
$
63
Commodities
$
―
$ ―
$
―
$ 3
$
―
$
―
$
―
$
3
Cash and Cash Equivalents
$
33
$ 35
$
23
$ 34
$
―
$
―
$
56
$
69
Total
$
724
$ 709
$
494
$ 482
$
210
$
203
$
1,428
$
1,394
Other items to reconcile to fair
value of plan assets
$
8
$
11
Fair value of plan assets
$
1,436
$
1,405
Publicly traded equities are valued at the closing price reported in the active market in which the individual securities are
traded. Index funds are valued at the NAV as determined by the custodian of the fund. The NAV is based on the fair value
of the underlying assets owned by the fund, minus its liabilities then divided by the number of units outstanding.
Long/short equity interests are valued using the NAV as determined by the administrator or custodian of the fund.
Long/short equity interests, which have a redemption right in the near term and are past any lock-up redemption period,
are classified as level 2. A long/short equity interest was moved from level 3 to level 2 during 2014 because the lock-up
redemption period had expired.
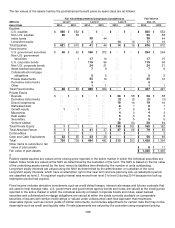
Fixed income includes derivative investments such as credit default swaps, interest rate swaps and futures contracts that
are used to help manage risks. U.S. government and government agency bonds and notes are valued at the closing price
reported in the active market in which the individual security is traded. Corporate bonds and notes, asset backed
securities and collateralized mortgage obligations are valued at either the yields currently available on comparable
securities of issuers with similar credit ratings or valued under a discounted cash flow approach that maximizes
observable inputs, such as current yields of similar instruments, but includes adjustments for certain risks that may not be
observable such as credit and liquidity risks. Private placements are valued by the custodian using recognized pricing