3M 2014 Annual Report Download - page 118
Download and view the complete annual report
Please find page 118 of the 2014 3M annual report below. You can navigate through the pages in the report by either clicking on the pages listed below, or by using the keyword search tool below to find specific information within the annual report.-
 1
1 -
2
-
3
-
4
-
5
-
6
-
7
-
8
-
9
-
10
-
11
-
12
-
13
-
14
-
15
-
16
-
17
-
18
-
19
-
20
-
21
-
22
-
23
-
24
-
25
-
26
-
27
-
28
-
29
-
30
-
31
-
32
-
33
-
34
-
35
-
36
-
37
-
38
-
39
-
40
-
41
-
42
-
43
-
44
-
45
-
46
-
47
-
48
-
49
-
50
-
51
-
52
-
53
-
54
-
55
-
56
-
57
-
58
-
59
-
60
-
61
-
62
-
63
-
64
-
65
-
66
-
67
-
68
-
69
-
70
-
71
-
72
-
73
-
74
-
75
-
76
-
77
-
78
-
79
-
80
-
81
-
82
-
83
-
84
-
85
-
86
-
87
-
88
-
89
-
90
-
91
-
92
-
93
-
94
-
95
-
96
-
97
-
98
-
99
-
100
-
101
-
102
-
103
-
104
-
105
-
106
-
107
-
 108
108 -
 109
109 -
 110
110 -
 111
111 -
 112
112 -
 113
113 -
 114
114 -
 115
115 -
 116
116 -
 117
117 -
 118
118 -
 119
119 -
 120
120 -
 121
121 -
 122
122 -
 123
123 -
 124
124 -
 125
125 -
 126
126 -
 127
127 -
 128
128 -
129
-
130
-
131
-
132
 |
 |

112
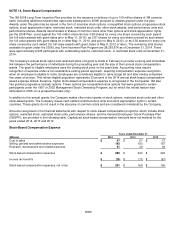
Stock Option Program
The following table summarizes stock option activity for the years ended December 31:
2014
2013
2012
Number of
Options
Weighted
Average
Exercise Price
Number of
Options
Weighted
Average
Exercise Price
Number of
Options
Weighted
Average
Exercise Price
Under option —
January 1
43,938,778
$
83.84
56,565,030
$
80.33 64,148,415 $
77.28
Granted:
Annual
5,736,183
126.77
6,220,810
101.55 5,770,190 87.91
Progressive (Reload)
―
―
140,447
109.83 110,065 89.65
Other
―
―
191
119.62 51,661 89.25
Exercised
(10,219,261)
82.37
(18,825,218)
79.25 (13,123,617) 68.78
Canceled (220,143) 105.11
(162,482)
89.92 (391,684) 83.65
December 31 39,235,557 $
90.38 43,938,778
$
83.84 56,565,030 $
80.33
Options exercisable
December 31 27,502,208 $
81.42 32,038,228
$
79.58 45,207,143 $
78.78
Stock options vest over a period from one to three years with the expiration date at 10 years from date of grant.
Outstanding options under grant include grants from previous plans. As of December 31, 2014, there was $59 million of
compensation expense that has yet to be recognized related to non-vested stock option based awards. This expense is
expected to be recognized over the remaining weighted-average vesting period of 21 months. For options outstanding at
December 31, 2014, the weighted-average remaining contractual life was 65 months and the aggregate intrinsic value
was $2.901 billion. For options exercisable at December 31, 2014, the weighted-average remaining contractual life was
50 months and the aggregate intrinsic value was $2.280 billion.
The total intrinsic values of stock options exercised during 2014, 2013 and 2012 was $615 million, $562 million and $282
million, respectively. Cash received from options exercised during 2014, 2013 and 2012 was $842 million, $1.492 billion
and $903 million, respectively. The Company’s actual tax benefits realized for the tax deductions related to the exercise of
employee stock options for 2014, 2013 and 2012 was $226 million, $208 million and $98 million, respectively.
The Company does not have a specific policy to repurchase common shares to mitigate the dilutive impact of options;
however, the Company has historically made adequate discretionary purchases, based on cash availability, market
trends, and other factors, to satisfy stock option exercise activity.
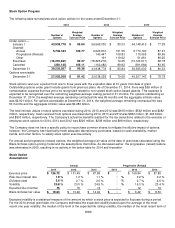
For annual and progressive (reload) options, the weighted average fair value at the date of grant was calculated using the
Black-Scholes option-pricing model and the assumptions that follow. As discussed earlier, the progressive (reload) feature
was eliminated in 2005, resulting in no activity in the below table for 2014 and thereafter.
Stock Option
Assumptions
Annual Progressive (Reload)
2014 2013 2012 2014 2013
2012
Exercise price $
126.72
$
101.49
$
87.89 $
― $
109.84
$
87.89
Risk-free interest rate 1.9
%
1.2
%
1.1 %
― %
0.2
%
0.2
%
Dividend yield 2.6
%
2.7
%
2.6 %
― %
2.7
%
2.6
%
Volatility
20.8
%
20.0
%
24.5 %
― %
16.3
%
23.4
%
Expected life (months) 75
75
74 ― 12
19
Black-Scholes fair value $
19.63
$
13.46
$
14.94 $
― $
6.42
$
8.50
Expected volatility is a statistical measure of the amount by which a stock price is expected to fluctuate during a period.
For the 2014 annual grant date, the Company estimated the expected volatility based upon the average of the most
recent one year volatility, the median of the term of the expected life rolling volatility, the median of the most recent term of