3M 2014 Annual Report Download - page 75
Download and view the complete annual report
Please find page 75 of the 2014 3M annual report below. You can navigate through the pages in the report by either clicking on the pages listed below, or by using the keyword search tool below to find specific information within the annual report.-
 1
1 -
2
-
3
-
4
-
5
-
6
-
7
-
8
-
9
-
10
-
11
-
12
-
13
-
14
-
15
-
16
-
17
-
18
-
19
-
20
-
21
-
22
-
23
-
24
-
25
-
26
-
27
-
28
-
29
-
30
-
31
-
32
-
33
-
34
-
35
-
36
-
37
-
38
-
39
-
40
-
41
-
42
-
43
-
44
-
45
-
46
-
47
-
48
-
49
-
50
-
51
-
52
-
53
-
54
-
55
-
56
-
57
-
58
-
59
-
60
-
61
-
62
-
63
-
64
-
 65
65 -
 66
66 -
 67
67 -
 68
68 -
 69
69 -
 70
70 -
 71
71 -
 72
72 -
 73
73 -
 74
74 -
 75
75 -
 76
76 -
 77
77 -
 78
78 -
 79
79 -
 80
80 -
 81
81 -
 82
82 -
 83
83 -
 84
84 -
 85
85 -
86
-
87
-
88
-
89
-
90
-
91
-
92
-
93
-
94
-
95
-
96
-
97
-
98
-
99
-
100
-
101
-
102
-
103
-
104
-
105
-
106
-
107
-
108
-
109
-
110
-
111
-
112
-
113
-
114
-
115
-
116
-
117
-
118
-
119
-
120
-
121
-
122
-
123
-
124
-
125
-
126
-
127
-
128
-
129
-
130
-
131
-
132
 |
 |

69
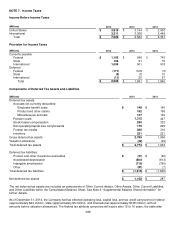
NOTE 7. Income Taxes
Income Before Income Taxes
(Millions)
2014
2013
2012
United States
$
3,815
$ 3,194
$ 2,902
International
3,211
3,368
3,449
Total
$
7,026
$ 6,562
$ 6,351
Provision for Income Taxes
(Millions)
2014
2013
2012
Currently payable
Federal
$
1,103
$ 948
$ 743
State
108
91
75
International
1,008
901
918
Deferred
Federal
(171)
(123)
(3)
State
(9)
(2)
10
International
(11)
26
97
Total
$
2,028
$ 1,841
$ 1,840
Components of Deferred Tax Assets and Liabilities
(Millions)
2014
2013
Deferred tax assets:
Accruals not currently deductible
Employee benefit costs $
148
$
140
Product and other claims 152
155
Miscellaneous accruals 137
130
Pension costs 1,312
447
Stock-based compensation 290
322
Net operating/capital loss carryforwards 175
225
Foreign tax credits 360
316
Inventory 221
221
Gross deferred tax assets 2,795
1,956
Valuation allowance
(22)
(23)
Total deferred tax assets $
2,773
$
1,933
Deferred tax liabilities:
Product and other insurance receivables $
(31)
$
(46)
Accelerated depreciation
(804)
(813)
Intangible amortization
(719)
(780)
Other
(61)
(7)
Total deferred tax liabilities $
(1,615)
$
(1,646)
Net deferred tax assets $
1,158
$
287
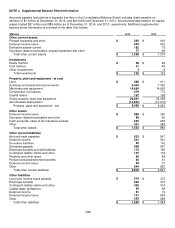
The net deferred tax assets are included as components of Other Current Assets, Other Assets, Other Current Liabilities,
and Other Liabilities within the Consolidated Balance Sheet. See Note 4 “Supplemental Balance Sheet Information” for
further details.
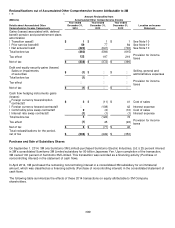
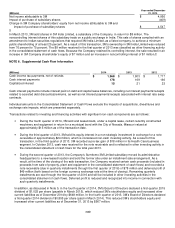
As of December 31, 2014, the Company had tax effected operating loss, capital loss, and tax credit carryovers for federal
(approximately $24 million), state (approximately $3 million), and international (approximately $148 million), with all
amounts before valuation allowances. The federal tax attribute carryovers will expire after 15 to 16 years, the state after