3M 2014 Annual Report Download - page 85
Download and view the complete annual report
Please find page 85 of the 2014 3M annual report below. You can navigate through the pages in the report by either clicking on the pages listed below, or by using the keyword search tool below to find specific information within the annual report.-
 1
1 -
2
-
3
-
4
-
5
-
6
-
7
-
8
-
9
-
10
-
11
-
12
-
13
-
14
-
15
-
16
-
17
-
18
-
19
-
20
-
21
-
22
-
23
-
24
-
25
-
26
-
27
-
28
-
29
-
30
-
31
-
32
-
33
-
34
-
35
-
36
-
37
-
38
-
39
-
40
-
41
-
42
-
43
-
44
-
45
-
46
-
47
-
48
-
49
-
50
-
51
-
52
-
53
-
54
-
55
-
56
-
57
-
58
-
59
-
60
-
61
-
62
-
63
-
64
-
65
-
66
-
67
-
68
-
69
-
70
-
71
-
72
-
73
-
74
-
 75
75 -
 76
76 -
 77
77 -
 78
78 -
 79
79 -
 80
80 -
 81
81 -
 82
82 -
 83
83 -
 84
84 -
 85
85 -
 86
86 -
 87
87 -
 88
88 -
 89
89 -
 90
90 -
 91
91 -
 92
92 -
 93
93 -
 94
94 -
 95
95 -
96
-
97
-
98
-
99
-
100
-
101
-
102
-
103
-
104
-
105
-
106
-
107
-
108
-
109
-
110
-
111
-
112
-
113
-
114
-
115
-
116
-
117
-
118
-
119
-
120
-
121
-
122
-
123
-
124
-
125
-
126
-
127
-
128
-
129
-
130
-
131
-
132
 |
 |

79
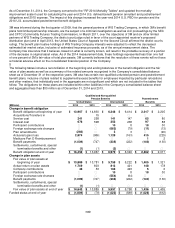
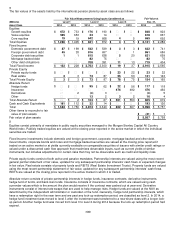
Qualified and Non-qualified
Pension Benefits Postretirement
United States
International
Benefits
(Millions)
2014
2013
2014
2013
2014
2013
Amounts recognized in the
Consolidated Balance Sheet as of
Dec. 31,
Non-current assets
$
3
$ 399
$
43
$ 178
$
―
$ ―
Accrued benefit cost
Current liabilities
(46)
(47)
(10)
(10)
(4)
(4)
Non-current liabilities
(1,766)
(430)
(1,055
)
(756)
(1,022)
(608)
Ending balance
$
(1,809)
$
(78)
$
(1,022)
$
(588)
$
(1,026)
$
(612)
Amounts recognized in accumulated
other comprehensive income as of
Dec. 31,
Net transition obligation (asset)
$
―
$ ―
$
(3)
$
(4)
$
―
$ ―
Net actuarial loss (gain)
5,462
3,537
2,200
1,949
914
616
Prior service cost (credit)
(251)
20
(93)
(117)
(102)
(151)
Ending balance
$
5,211
$
3,557
$
2,104
$ 1,828
$
812
$ 465
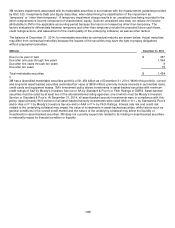
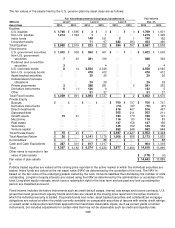
The balance of amounts recognized for international plans in accumulated other comprehensive income as of
December 31 in the preceding table are presented based on the foreign currency exchange rate on that date.
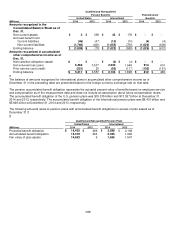
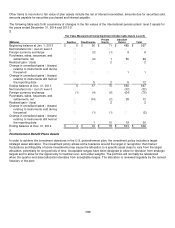
The pension accumulated benefit obligation represents the actuarial present value of benefits based on employee service
and compensation as of the measurement date and does not include an assumption about future compensation levels.
The accumulated benefit obligation of the U.S. pension plans was $15.335 billion and $13.357 billion at December 31,
2014 and 2013, respectively. The accumulated benefit obligation of the international pension plans was $6.401 billion and
$5.825 billion at December 31, 2014 and 2013, respectively.
The following amounts relate to pension plans with accumulated benefit obligations in excess of plan assets as of
December 31:
Qualified and Non-qualified Pension Plans
United States
International
(Millions)
2014
2013
2014
2013
Projected benefit obligation
$
16,435
$
486
$
2,588
$ 2,198
Accumulated benefit obligation
15,319
463
2,335
1,960
Fair value of plan assets
14,623
9
1,636
1,547