3M 2014 Annual Report Download - page 80
Download and view the complete annual report
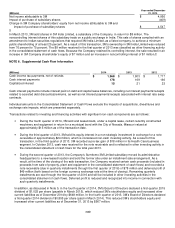
Please find page 80 of the 2014 3M annual report below. You can navigate through the pages in the report by either clicking on the pages listed below, or by using the keyword search tool below to find specific information within the annual report.
74
NOTE 9. Long-Term Debt and Short-Term Borrowings
The following debt tables reflects effective interest rates, which include the impact of interest rate swaps, as of December
31, 2014. The reference column in the table below indicates if debt was issued on a combined basis, with the combined
debt separated to show the impact of fixed versus floating effective interest rates as of December 31, 2014. Combined
debt is referenced as A1, A2; D1, D2; and G1, G2. The effective interest rate is subject to future changes based on
underlying indices related to 3M’s floating rate debt and interest rate swaps. This reference column is also used to refer to
later discussion concerning this debt. Carrying value includes the impact of derivative/hedging activity. Long-term debt
and short-term borrowings as of December 31 consisted of the following:
Long
-
Term Debt
Currency/ Effective Final
(Millions) Fixed vs.
Interest
Maturity Carrying Value
Description / 2014 Principal Amount Reference
Floating
Rate
Date 2014 2013
Eurobond (775 million Euros)
A1
Euro Fixed
―
%
―
$
―
$
1,075
Eurobond (250 million Euros)
A2
Euro Floating
―
%
―
―
349
Medium-term note ($1 billion)
B
USD Fixed
1.62
%
2016
997
995
Medium-term note (750 million Euros)
C
Euro Fixed
1.71
%
2026
897
―
Eurobond (300 million Euros)
D1
Euro Fixed
1.97
%
2021
363
411
Eurobond (300 million Euros)
D2
Euro Floating
0.40
%
2021
390
404
30-year bond ($750 million)
E
USD Fixed
5.73
%
2037
748
748
Medium-term note ($650 million)
F
USD Fixed
1.10
%
2017
649
648
Medium-term note ($600 million)
G1
USD Floating
0.28
%
2019
594
―
Medium-term note ($25 million)
G2
USD Fixed
1.74
%
2019
25
―
Medium-term note (500 million Euros)
H
Euro Floating
0.31
%
2018
608
―
Medium-term note ($600 million)
I
USD Fixed
2.17
%
2022
593
592
30-year debenture ($330 million)
J
USD Fixed
6.01
%
2028
344
346
Medium-term note ($325 million)
K
USD Fixed
4.05
%
2044
315
―
UK borrowing (66 million GBP)
L
GBP Floating
―
%
―
―
109
Floating rate note ($96 million)
M
USD Floating
―
%
2041
96
97
Floating rate note ($55 million)
N
USD Floating
―
%
2044
55
59
Other borrowings
O
Various
4.17
%
2015-2040
112
79
Total long-term debt
$
6,786
$
5,912
Less: current portion of long-term debt
55
1,586
Long-term debt (excluding current portion)
$
6,731
$
4,326
Post-Swap Borrowing (Long-Term Debt, Including Current Portion)
2014
2013
(Millions) Carrying
Value Effective
Interest Rate
Carrying
Value Effective
Interest Rate
Fixed-rate debt
$
4,933
2.74
%
$
4,821
3.19 %
Floating-rate debt
1,853
0.53
%
1,091
0.48 %
Total long-term debt, including current portion
$
6,786
$
5,912
Short
-
Term Borrowings and Current Portion of Long
-
Term Debt
Effective
Carrying Value
(Millions) Interest Rate
2014 2013
Current portion of long-term debt ― %
$
55
$
1,586
U.S. dollar commercial paper ― %
―
―
Other borrowings 2.46 %
51
97
Total short-term borrowings and current portion of long-term debt
$
106
$
1,683


