3M 2014 Annual Report Download - page 71
Download and view the complete annual report
Please find page 71 of the 2014 3M annual report below. You can navigate through the pages in the report by either clicking on the pages listed below, or by using the keyword search tool below to find specific information within the annual report.-
 1
1 -
2
-
3
-
4
-
5
-
6
-
7
-
8
-
9
-
10
-
11
-
12
-
13
-
14
-
15
-
16
-
17
-
18
-
19
-
20
-
21
-
22
-
23
-
24
-
25
-
26
-
27
-
28
-
29
-
30
-
31
-
32
-
33
-
34
-
35
-
36
-
37
-
38
-
39
-
40
-
41
-
42
-
43
-
44
-
45
-
46
-
47
-
48
-
49
-
50
-
51
-
52
-
53
-
54
-
55
-
56
-
57
-
58
-
59
-
60
-
 61
61 -
 62
62 -
 63
63 -
 64
64 -
 65
65 -
 66
66 -
 67
67 -
 68
68 -
 69
69 -
 70
70 -
 71
71 -
 72
72 -
 73
73 -
 74
74 -
 75
75 -
 76
76 -
 77
77 -
 78
78 -
 79
79 -
 80
80 -
 81
81 -
82
-
83
-
84
-
85
-
86
-
87
-
88
-
89
-
90
-
91
-
92
-
93
-
94
-
95
-
96
-
97
-
98
-
99
-
100
-
101
-
102
-
103
-
104
-
105
-
106
-
107
-
108
-
109
-
110
-
111
-
112
-
113
-
114
-
115
-
116
-
117
-
118
-
119
-
120
-
121
-
122
-
123
-
124
-
125
-
126
-
127
-
128
-
129
-
130
-
131
-
132
 |
 |

65
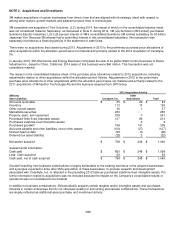
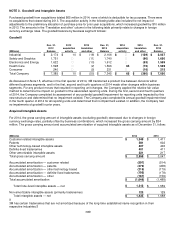
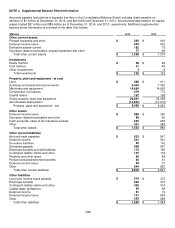
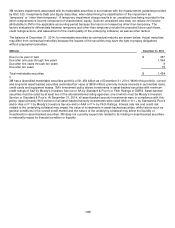
NOTE 4. Supplemental Balance Sheet Information
Accounts payable (included as a separate line item in the Consolidated Balance Sheet) includes drafts payable on
demand of $1 million at December 31, 2014, and $24 million at December 31, 2013. Accumulated depreciation for capital
leases totaled $87 million and $85 million as of December 31, 2014, and 2013, respectively. Additional supplemental
balance sheet information is provided in the table that follows.
(Millions)
2014
2013
Other current assets
Prepaid expenses and other
$
595
$
602
Deferred income taxes
444
502
Derivative assets-current
182
76
Insurance related receivables, prepaid expenses and other
77
99
Total other current assets
$
1,298
$
1,279
Investm
ents
Equity method
$
58
$
69
Cost method
41
45
Other investments
3
8
Total investments
$
102
$
122
Property, plant and equipment
-
at cost
Land
$
368
$
411
Buildings and leasehold improvements
6,943
7,062
Machinery and equipment
14,684
14,665
Construction in progress
679
772
Capital leases
167
158
Gross property, plant and equipment
22,841
23,068
Accumulated depreciation
(14,352)
(14,416)
Property, plant and equipment - net
$
8,489
$
8,652
Other assets
Deferred income taxes
$
889
$
360
Insurance related receivables and other
89
96
Cash surrender value of life insurance policies
245
236
Other
331
288
Total other assets
$
1,554
$
980
Other current liabilities
Accrued trade payables
$
533
$
547
Deferred income
541
521
Derivative liabilities
39
103
Dividends payable
648
567
Employee benefits and withholdings
172
195
Contingent liability claims and other
157
119
Property and other taxes
90
88
Pension and postretirement benefits
60
61
Deferred income taxes
34
37
Other
644
653
Total other current liabilities
$
2,918
$
2,891
Other liabilities
Long term income taxes payable
$
519
$
472
Employee benefits
262
315
Contingent liability claims and other
300
314
Capital lease obligations
59
58
Deferred income
21
19
Deferred income taxes
141
538
Other
253
268
Total other liabilities
$
1,555
$
1,984