3M 2014 Annual Report Download - page 59
Download and view the complete annual report
Please find page 59 of the 2014 3M annual report below. You can navigate through the pages in the report by either clicking on the pages listed below, or by using the keyword search tool below to find specific information within the annual report.-
 1
1 -
2
-
3
-
4
-
5
-
6
-
7
-
8
-
9
-
10
-
11
-
12
-
13
-
14
-
15
-
16
-
17
-
18
-
19
-
20
-
21
-
22
-
23
-
24
-
25
-
26
-
27
-
28
-
29
-
30
-
31
-
32
-
33
-
34
-
35
-
36
-
37
-
38
-
39
-
40
-
41
-
42
-
43
-
44
-
45
-
46
-
47
-
48
-
 49
49 -
 50
50 -
 51
51 -
 52
52 -
 53
53 -
 54
54 -
 55
55 -
 56
56 -
 57
57 -
 58
58 -
 59
59 -
 60
60 -
 61
61 -
 62
62 -
 63
63 -
 64
64 -
 65
65 -
 66
66 -
 67
67 -
 68
68 -
 69
69 -
70
-
71
-
72
-
73
-
74
-
75
-
76
-
77
-
78
-
79
-
80
-
81
-
82
-
83
-
84
-
85
-
86
-
87
-
88
-
89
-
90
-
91
-
92
-
93
-
94
-
95
-
96
-
97
-
98
-
99
-
100
-
101
-
102
-
103
-
104
-
105
-
106
-
107
-
108
-
109
-
110
-
111
-
112
-
113
-
114
-
115
-
116
-
117
-
118
-
119
-
120
-
121
-
122
-
123
-
124
-
125
-
126
-
127
-
128
-
129
-
130
-
131
-
132
 |
 |

53
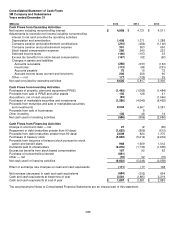
Consolidated S
tatement of Cash Flows
3M Company and Subsidiaries
Years ended December 31
(Millions)
2014
2013
2012
Cash Flows from Operating Activities
Net income including noncontrolling interest
$
4,998
$
4,721 $
4,511
Adjustments to reconcile net income including noncontrolling
interest to net cash provided by operating activities
Depreciation and amortization
1,408
1,371 1,288
Company pension and postretirement contributions
(215)
(482)
(1,146)
Company pension and postretirement expense
391
553 650
Stock-based compensation expense
280
240 223
Deferred income taxes
(146)
(167)
33
Excess tax benefits from stock-based compensation
(167)
(92)
(62)
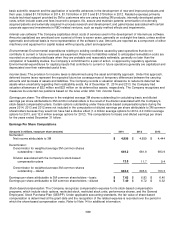
Changes in assets and liabilities
Accounts receivable
(268)
(337)
(133)
Inventories
(113)
(86)
(251)
Accounts payable
75
16
72
Accrued income taxes (current and long-term)
206
206 90
Other — net
177
(126)
25
Net cash provided by operating activities
6,626
5,817 5,300
Cash Flows from Investing Activities
Purchases of property, plant and equipment (PP&E)
(1,493)
(1,665)
(1,484)
Proceeds from sale of PP&E and other assets
135
128 41
Acquisitions, net of cash acquired
(94)
―
(1,046)
Purchases of marketable securities and investments
(1,280)
(4,040)
(5,492)
Proceeds from maturities and sale of marketable securities
and investments
2,034
4,667 5,281
Proceeds from sale of businesses
―
8 ―
Other investing
102
46
14
Net cash used in investing activities
(5
96)
(856)
(2,686)
Cash Flows from Financing Activities
Change in short-term debt — net
27
(2)
(36)
Repayment of debt (maturities greater than 90 days)
(1,625)
(859)
(6
12)
Proceeds from debt (maturities greater than 90 days)
2,608
824 1,370
Purchases of treasury stock
(5,652)
(5,212)
(2,204)
Proceeds from issuance of treasury stock pursuant to stock
option and benefit plans
968
1,609 1,012
Dividends paid to shareholders
(2,216)
(1,730)
(1,635)
Excess tax benefits from stock-based compensation
167
92 62
Purchase of noncontrolling interest
(861)
― ―
Other — net
(19)
32
(15)
Net cash used in financing activities
(6,603)
(5,246)
(2,058)
Effect of exchange rate changes on cash and cash equivalents
(111)
(17)
108
Net increase (decrease) in cash and cash equivalents
(684)
(302)
664
Cash and cash equivalents at beginning of year
2,581
2,883 2,219
Cash and cash equivalents at end of year
$
1,897
$
2,581 $
2,883
The accompanying Notes to Consolidated Financial Statements are an integral part of this statement.