3M 2014 Annual Report Download - page 29
Download and view the complete annual report
Please find page 29 of the 2014 3M annual report below. You can navigate through the pages in the report by either clicking on the pages listed below, or by using the keyword search tool below to find specific information within the annual report.-
 1
1 -
2
-
3
-
4
-
5
-
6
-
7
-
8
-
9
-
10
-
11
-
12
-
13
-
14
-
15
-
16
-
17
-
18
-
 19
19 -
 20
20 -
 21
21 -
 22
22 -
 23
23 -
 24
24 -
 25
25 -
 26
26 -
 27
27 -
 28
28 -
 29
29 -
 30
30 -
 31
31 -
 32
32 -
 33
33 -
 34
34 -
 35
35 -
 36
36 -
 37
37 -
 38
38 -
 39
39 -
40
-
41
-
42
-
43
-
44
-
45
-
46
-
47
-
48
-
49
-
50
-
51
-
52
-
53
-
54
-
55
-
56
-
57
-
58
-
59
-
60
-
61
-
62
-
63
-
64
-
65
-
66
-
67
-
68
-
69
-
70
-
71
-
72
-
73
-
74
-
75
-
76
-
77
-
78
-
79
-
80
-
81
-
82
-
83
-
84
-
85
-
86
-
87
-
88
-
89
-
90
-
91
-
92
-
93
-
94
-
95
-
96
-
97
-
98
-
99
-
100
-
101
-
102
-
103
-
104
-
105
-
106
-
107
-
108
-
109
-
110
-
111
-
112
-
113
-
114
-
115
-
116
-
117
-
118
-
119
-
120
-
121
-
122
-
123
-
124
-
125
-
126
-
127
-
128
-
129
-
130
-
131
-
132
 |
 |

23
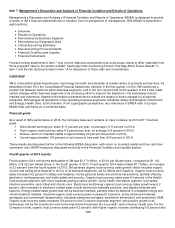
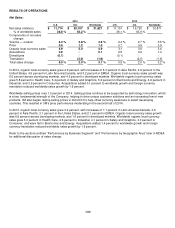
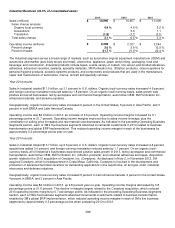
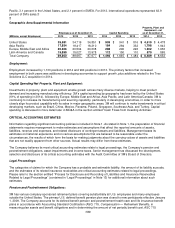
Technologies) were partially offset by lower pension and postretirement expense. R&D, measured as a percent of sales,
was 5.6 percent in both 2014 and 2013, compared to 5.5 percent in 2012.
Operating Income:
3M uses operating income as one of its primary business segment performance measurement tools.
Operating income margins were 22.4 percent in 2014 compared to 21.6 in 2013, an increase of 0.8 percentage points.
These results included a 1.0 percentage point benefit from the combination of higher selling prices and lower raw material
costs. In addition, lower year-on-year pension and postretirement benefit costs provided a 0.5 percentage point benefit
and profit leverage on organic volume growth added 0.3 percentage points. Items that reduced operating income margins
included a 0.6 percentage point impact from strategic investments, which included investments in disruptive R&D,
business transformation, the supply chain center of expertise in Europe, and portfolio management actions. The Company
invested $90 million in 2014 in portfolio management actions to position 3M for greater success. Foreign currency effects
reduced operating income margins by 0.3 percentage points, and the Treo acquisition reduced operating income margins
by 0.1 percentage points.
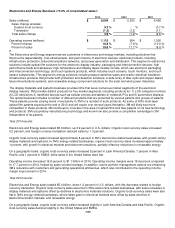
Operating income margins were 21.6 percent in 2013, compared to 21.7 in 2012, a decrease of 0.1 percentage points.
Items that reduced operating income margins included a 0.5 percentage point impact from lower factory
utilization/productivity, along with a 0.4 percentage point impact from strategic investments, which included business
transformation, along with more R&D aimed at disruptive innovation. The recently enacted medical device excise tax in
the U.S., foreign currency effects, acquisition impacts, and other net impacts reduced operating income margins by 0.7
percentage points. These factors were largely offset by items that increased operating income margins, which included a
1.2 percentage point benefit from the combination of selling price increases and raw material cost decreases. Finally,
lower pension/postretirement benefit costs increased operating income margins by 0.3 percentage points.
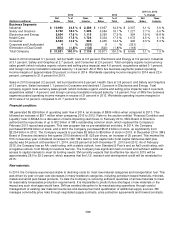
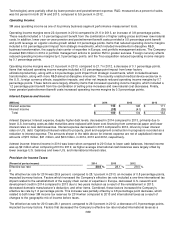
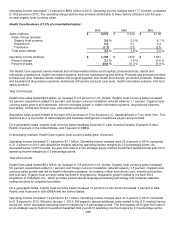
Interest Expense and Income:
(Millions)
2014
2013
2012
Interest expense
$
142
$
145 $
171
Interest income
(33)
(41)
(39)
Total
$
109
$
104 $
132
Interest Expense: Interest expense, despite higher debt levels, decreased in 2014 compared to 2013, primarily due to
lower U.S. borrowing costs as debt maturities were replaced with lower cost financing from commercial paper and lower
interest rates on new debt issuances. Interest expense decreased in 2013 compared to 2012, driven by lower interest
rates on U.S. debt. Capitalized interest related to property, plant and equipment construction in progress is recorded as a
reduction to interest expense. The amounts shown in the table above for interest expense are net of capitalized interest
amounts of $15 million, $21 million, and $23 million, in 2014, 2013 and 2012, respectively.
Interest Income: Interest income in 2014 was lower when compared to 2013 due to lower cash balances. Interest income
was up $2 million when comparing 2013 to 2012, as higher average international cash balances were largely offset by
lower average U.S. balances and lower U.S. and international interest rates.
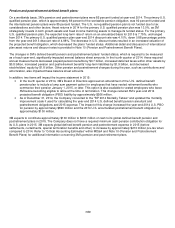
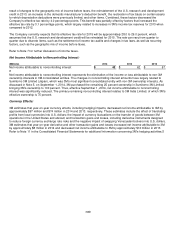
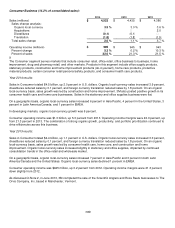
Provision for Income Taxes:
(Percent of pre-tax income)
2014 2013 2012
Effective tax rate
28.9
%
28.1
%
29.0
%
The effective tax rate for 2014 was 28.9 percent, compared to 28.1 percent in 2013, an increase of 0.8 percentage points,
impacted by many factors. Factors which increased the Company’s effective tax rate included a one-time international tax
impact related to the establishment of the supply chain center of expertise in Europe, decreased U.S. research and
development credit in 2014 compared to 2013 due to two years inclusion as a result of the reinstatement in 2013,
decreased domestic manufacturer’s deduction, and other items. Combined, these factors increased the Company’s
effective tax rate by 1.6 percentage points. This increase was partially offset by a 0.8 percentage point decrease, which
related to both lower 3M income tax reserves for 2014 when compared to 2013 and international taxes as a result of
changes to the geographic mix of income before taxes.
The effective tax rate for 2013 was 28.1 percent, compared to 29.0 percent in 2012, a decrease of 0.9 percentage points,
impacted by many factors. Factors that decreased the Company’s effective tax rate included international taxes as a