3M 2014 Annual Report Download - page 123
Download and view the complete annual report
Please find page 123 of the 2014 3M annual report below. You can navigate through the pages in the report by either clicking on the pages listed below, or by using the keyword search tool below to find specific information within the annual report.-
 1
1 -
2
-
3
-
4
-
5
-
6
-
7
-
8
-
9
-
10
-
11
-
12
-
13
-
14
-
15
-
16
-
17
-
18
-
19
-
20
-
21
-
22
-
23
-
24
-
25
-
26
-
27
-
28
-
29
-
30
-
31
-
32
-
33
-
34
-
35
-
36
-
37
-
38
-
39
-
40
-
41
-
42
-
43
-
44
-
45
-
46
-
47
-
48
-
49
-
50
-
51
-
52
-
53
-
54
-
55
-
56
-
57
-
58
-
59
-
60
-
61
-
62
-
63
-
64
-
65
-
66
-
67
-
68
-
69
-
70
-
71
-
72
-
73
-
74
-
75
-
76
-
77
-
78
-
79
-
80
-
81
-
82
-
83
-
84
-
85
-
86
-
87
-
88
-
89
-
90
-
91
-
92
-
93
-
94
-
95
-
96
-
97
-
98
-
99
-
100
-
101
-
102
-
103
-
104
-
105
-
106
-
107
-
108
-
109
-
110
-
111
-
112
-
 113
113 -
 114
114 -
 115
115 -
 116
116 -
 117
117 -
 118
118 -
 119
119 -
 120
120 -
 121
121 -
 122
122 -
 123
123 -
 124
124 -
 125
125 -
 126
126 -
 127
127 -
 128
128 -
 129
129 -
 130
130 -
 131
131 -
 132
132
 |
 |

117
receive credit for the associated net sales it initiated and the related approximate operating income. The assigned
operating income related to dual credit activity may differ from operating income that would result from actual costs
associated with such sales. The offset to the dual credit business segment reporting is reflected as a reconciling item
entitled “Elimination of Dual Credit,” such that sales and operating income for the U.S. in total are unchanged.
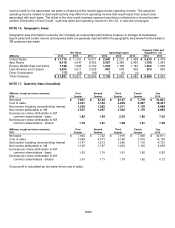
NOTE 16. Geographic Areas
Geographic area information is used by the Company as a secondary performance measure to manage its businesses.
Export sales and certain income and expense items are generally reported within the geographic area where the final sales to
3M customers are made.
Property, Plant and
Equipment - net
Net Sales
Operating Income
(Millions)
2014
2013
2012
2014
2013
2012
2014
2013
United States
$
11,714
$
11,151
$
10,571
$
2,540
$
2,210
$
1,938
$
4,619
$
4,478
Asia Pacific
9,418
9,047
9,092
2,487
2,386
2,450
1,798
1,943
Europe, Middle East and Africa
7,198
7,085
6,730
1,234
1,168
1,163
1,502
1,636
Latin America and Canada
3,504
3,611
3,529
867
908
936
570
595
Other Unallocated
(13)
(23)
(18)
7
(6)
(4)
―
―
Total Company
$
31,821
$
30,871
$
29,904
$
7,135
$
6,666
$
6,483
$
8,489
$
8,652
NOTE 17. Quarterly Data (Unaudited)
(Millions, except per-share amounts)
First
Second Third Fourth Year
2014
Quarter
Quarter Quarter Quarter 2014
Net sales
$
7,831
$
8,134
$
8,137
$
7,719
$
31,821
Cost of sales
4,031
4,184
4,205
4,027
16,447
Net income including noncontrolling interest
1,225
1,283
1,311
1,179
4,998
Net income attributable to 3M
1,207
1,267
1,303
1,179
4,956
Earnings per share attributable to 3M
common shareholders - basic
1.83
1.94
2.02
1.85
7.63
Earnings per share attributable to 3M
common shareholders - diluted
1.79
1.91
1.98
1.81
7.49
(Millions, except per-share amounts)
First
Second Third Fourth Year
2013
Quarter
Quarter Quarter Quarter 2013
Net sales
$
7,634 $
7,752 $
7,916 $
7,569 $
30,871
Cost of sales 3,969 4,013 4,148 3,976 16,106
Net income including noncontrolling interest
1,147 1,213 1,245 1,116 4,721
Net income attributable to 3M 1,129 1,197 1,230 1,103 4,659
Earnings per share attributable to 3M
common shareholders - basic 1.63 1.74 1.81 1.65 6.83
Earnings per share attributable to 3M
common shareholders - diluted 1.61 1.71 1.78 1.62 6.72
Gross profit is calculated as net sales minus cost of sales.