3M 2014 Annual Report Download - page 120
Download and view the complete annual report
Please find page 120 of the 2014 3M annual report below. You can navigate through the pages in the report by either clicking on the pages listed below, or by using the keyword search tool below to find specific information within the annual report.-
 1
1 -
2
-
3
-
4
-
5
-
6
-
7
-
8
-
9
-
10
-
11
-
12
-
13
-
14
-
15
-
16
-
17
-
18
-
19
-
20
-
21
-
22
-
23
-
24
-
25
-
26
-
27
-
28
-
29
-
30
-
31
-
32
-
33
-
34
-
35
-
36
-
37
-
38
-
39
-
40
-
41
-
42
-
43
-
44
-
45
-
46
-
47
-
48
-
49
-
50
-
51
-
52
-
53
-
54
-
55
-
56
-
57
-
58
-
59
-
60
-
61
-
62
-
63
-
64
-
65
-
66
-
67
-
68
-
69
-
70
-
71
-
72
-
73
-
74
-
75
-
76
-
77
-
78
-
79
-
80
-
81
-
82
-
83
-
84
-
85
-
86
-
87
-
88
-
89
-
90
-
91
-
92
-
93
-
94
-
95
-
96
-
97
-
98
-
99
-
100
-
101
-
102
-
103
-
104
-
105
-
106
-
107
-
108
-
109
-
 110
110 -
 111
111 -
 112
112 -
 113
113 -
 114
114 -
 115
115 -
 116
116 -
 117
117 -
 118
118 -
 119
119 -
 120
120 -
 121
121 -
 122
122 -
 123
123 -
 124
124 -
 125
125 -
 126
126 -
 127
127 -
 128
128 -
 129
129 -
 130
130 -
131
-
132
 |
 |

114
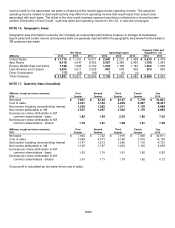
The following table summarizes performance share activity for the years ended December 31:
2014
2013
2012
Weighted
Average
Weighted
Average
Weighted
Average
Number of
Grant Date
Number of
Grant Date
Number of
Grant Date
Awards Fair Value Awards Fair Value
Awards Fair Value
Undistributed balance —
As of January 1
895,635
$
88.12
1,089,084 $
79.27
878,872 $
78.55
Granted
305,225
124.89
353,734 96.87
467,531 81.55
Distributed
(277,358)
84.74
(507,083) 75.16
― ―
Performance change
212,461
109.74
(6,949) 77.01
(178,838) 81.27
Forfeited
(36,212)
109.44
(33,151) 91.34
(78,481) 80.21
As of December 31 1,099,752 $
102.65 895,635 $
88.12
1,089,084 $
79.27
As of December 31, 2014, there was $22 million of compensation expense that has yet to be recognized related to
performance shares. This expense is expected to be recognized over the remaining weighted-average earnings period of
11 months. During the years ended December 31, 2014 and 2013, the total fair value of performance shares that were
distributed were $35 million and $52 million, respectively. The Company’s actual tax benefits realized for the tax
deductions related to the distribution of performance shares for the years ended December 31, 2014 and 2013 was $11
million and $16 million, respectively. There were no performance shares distributed or related tax benefits realized during
the year ended December 31, 2012.
General Employees’ Stock Purchase Plan (GESPP):
As of December 31, 2014, shareholders have approved 60 million shares for issuance under the Company’s GESPP.
Substantially all employees are eligible to participate in the plan. Participants are granted options at 85% of market value
at the date of grant. There are no GESPP shares under option at the beginning or end of each year because options are
granted on the first business day and exercised on the last business day of the same month.
Gen
eral Employees' Stock Purchase Plan
2014
2013
2012
Weighted
Weighted
Weighted
Average
Average
Average
Shares Exercise Price Shares Exercise Price
Shares Exercise Price
Options granted
1,073,956
$
118.73
1,259,247 $
93.46
1,455,545 $
75.32
Options exercised
(1,073,956)
118.73
(1,259,247) 93.46
(1,455,545) 75.32
Shares available for grant -
December 31 29,112,004 30,185,960 31,445,207
The weighted-average fair value per option granted during 2014, 2013 and 2012 was $20.95, $16.49 and $13.29,
respectively. The fair value of GESPP options was based on the 15% purchase price discount. The Company recognized
compensation expense for GESSP options of $22 million in 2014, $21 million in 2013 and $19 million in 2012.