3M 2014 Annual Report Download - page 27
Download and view the complete annual report
Please find page 27 of the 2014 3M annual report below. You can navigate through the pages in the report by either clicking on the pages listed below, or by using the keyword search tool below to find specific information within the annual report.-
 1
1 -
2
-
3
-
4
-
5
-
6
-
7
-
8
-
9
-
10
-
11
-
12
-
13
-
14
-
15
-
16
-
 17
17 -
 18
18 -
 19
19 -
 20
20 -
 21
21 -
 22
22 -
 23
23 -
 24
24 -
 25
25 -
 26
26 -
 27
27 -
 28
28 -
 29
29 -
 30
30 -
 31
31 -
 32
32 -
 33
33 -
 34
34 -
 35
35 -
 36
36 -
 37
37 -
38
-
39
-
40
-
41
-
42
-
43
-
44
-
45
-
46
-
47
-
48
-
49
-
50
-
51
-
52
-
53
-
54
-
55
-
56
-
57
-
58
-
59
-
60
-
61
-
62
-
63
-
64
-
65
-
66
-
67
-
68
-
69
-
70
-
71
-
72
-
73
-
74
-
75
-
76
-
77
-
78
-
79
-
80
-
81
-
82
-
83
-
84
-
85
-
86
-
87
-
88
-
89
-
90
-
91
-
92
-
93
-
94
-
95
-
96
-
97
-
98
-
99
-
100
-
101
-
102
-
103
-
104
-
105
-
106
-
107
-
108
-
109
-
110
-
111
-
112
-
113
-
114
-
115
-
116
-
117
-
118
-
119
-
120
-
121
-
122
-
123
-
124
-
125
-
126
-
127
-
128
-
129
-
130
-
131
-
132
 |
 |

21
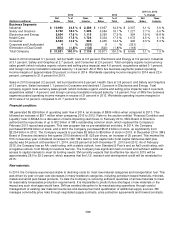
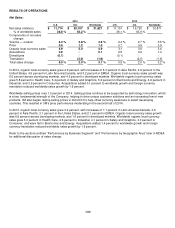
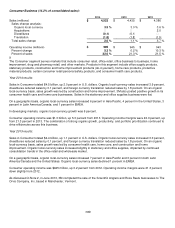
RESULTS OF OPERATIONS
Net Sales:
2014 2013
U.S. Intl. Worldwide U.S. Intl. Worldwide
Net sales (millions)
$
11,714
$
20,107
$
31,821
$
11,151 $
19,720
$
30,871
% of worldwide sales
36.8
%
63.2
%
36.1 %
63.9
%
Components of net sales
change:
Volume
— organic
4.4
%
3.8
%
3.9
%
2.4 %
2.7
%
2.5 %
Price
0.5
1.2
1.0
0.7 0.9
0.9
Organic local-currency sales
4.9
5.0
4.9
3.1 3.6
3.4
Acquisitions
0.2
―
0.1
2.5 0.9
1.4
Divestitures
(0.1)
―
―
(0.1) ―
―
Translation
―
(3.0)
(1.9)
― (2.5)
(1.6)
Total sales change
5.0
%
2.0
%
3.1
%
5.5 %
2.0
%
3.2 %
In 2014, organic local-currency sales grew 4.9 percent, with increases of 6.3 percent in Asia Pacific, 4.9 percent in the
United States, 4.5 percent in Latin America/Canada, and 3.2 percent in EMEA. Organic local-currency sales growth was
5.6 percent across developing markets, and 4.5 percent in developed markets. Worldwide organic local-currency sales
grew 5.8 percent in Health Care, 5.4 percent in Safety and Graphics, 5.2 percent in Electronics and Energy, 4.9 percent in
Industrial, and 3.9 percent in Consumer. Acquisitions added 0.1 percent to worldwide growth and foreign currency
translation reduced worldwide sales growth by 1.9 percent.
Worldwide selling prices rose 1.0 percent in 2014. Selling prices continue to be supported by technology innovation, which
is a key fundamental strength of the Company, helping to drive unique customer solutions and an increasing flow of new
products. 3M also began raising selling prices in mid-2013 to help offset currency weakness in select developing
countries. This resulted in 3M’s price performance moderating in the second half of 2014.
In 2013, organic local-currency sales grew 3.4 percent, with increases of 7.1 percent in Latin America/Canada, 3.6
percent in Asia Pacific, 3.1 percent in the United States, and 2.1 percent in EMEA. Organic local-currency sales growth
was 6.9 percent across developing markets, and 1.6 percent in developed markets. Worldwide organic local-currency
sales grew 5.0 percent in Health Care, 4.6 percent in Industrial, 4.1 percent in Safety and Graphics, 3.0 percent in
Consumer, and were flat in Electronics and Energy. Acquisitions added 1.4 percent to worldwide growth and foreign
currency translation reduced worldwide sales growth by 1.6 percent.
Refer to the sections entitled “Performance by Business Segment” and “Performance by Geographic Area” later in MD&A
for additional discussion of sales change.