3M 2011 Annual Report Download - page 99
Download and view the complete annual report
Please find page 99 of the 2011 3M annual report below. You can navigate through the pages in the report by either clicking on the pages listed below, or by using the keyword search tool below to find specific information within the annual report.-
 1
1 -
2
-
3
-
4
-
5
-
6
-
7
-
8
-
9
-
10
-
11
-
12
-
13
-
14
-
15
-
16
-
17
-
18
-
19
-
20
-
21
-
22
-
23
-
24
-
25
-
26
-
27
-
28
-
29
-
30
-
31
-
32
-
33
-
34
-
35
-
36
-
37
-
38
-
39
-
40
-
41
-
42
-
43
-
44
-
45
-
46
-
47
-
48
-
49
-
50
-
51
-
52
-
53
-
54
-
55
-
56
-
57
-
58
-
59
-
60
-
61
-
62
-
63
-
64
-
65
-
66
-
67
-
68
-
69
-
70
-
71
-
72
-
73
-
74
-
75
-
76
-
77
-
78
-
79
-
80
-
81
-
82
-
83
-
84
-
85
-
86
-
87
-
88
-
 89
89 -
 90
90 -
 91
91 -
 92
92 -
 93
93 -
 94
94 -
 95
95 -
 96
96 -
 97
97 -
 98
98 -
 99
99 -
 100
100 -
 101
101 -
 102
102 -
 103
103 -
 104
104 -
 105
105 -
 106
106 -
 107
107 -
 108
108 -
 109
109 -
110
-
111
-
112
-
113
-
114
-
115
-
116
-
117
-
118
-
119
-
120
-
121
-
122
-
123
-
124
-
125
-
126
-
127
-
128
-
129
-
130
-
131
-
132
 |
 |

93
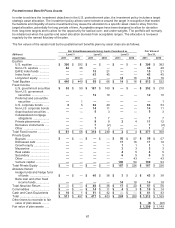
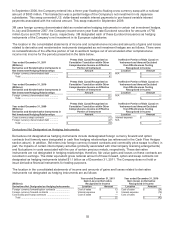
Year ended December 31, 2009
Gain (Loss) on Derivative
(Millions) Recognized in Income
Derivatives Not Designated as Hedging Instruments Location Amount
Foreign currency forward/option contracts .......................... Cost of sales $ (41 )
Foreign currency forward contracts ..................................... Interest expense 20
Commodity price swap contracts ........................................ Cost of sales 1
Total ............................................................................... $ (20 )
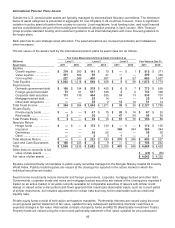
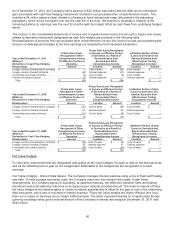
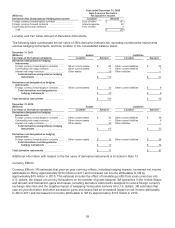
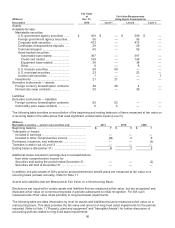
Location and Fair Value Amount of Derivative Instruments
The following table summarizes the fair value of 3M’s derivative instruments, excluding nonderivative instruments
used as hedging instruments, and their location in the consolidated balance sheet.
December 31, 2011
(Millions) Assets Liabilities
Fair Value of Derivative Instruments Location Amount Location Amount
Derivatives designated as hedging
instruments.....................................................
Foreign currency forward/option contracts ....... Other current assets $ 82 Other current liabilities $ 34
Commodity price swap contracts ..................... Other current assets
—
Other current liabilities 7
Interest rate swap contracts ............................. Other assets 28 Other liabilities —
Total derivatives designated as hedging
instruments ...........................................
$ 110 $ 41
Derivatives not designated as hedging
instruments.....................................................
Foreign currency forward/option contracts ....... Other current assets $ 25 Other current liabilities $ 8
Total derivatives not designated as
hedging instruments ............................
$ 25 $ 8
Total derivative instruments .............................
$ 135 $ 49
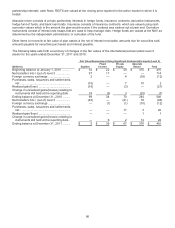
December 31, 2010
(Millions) Assets Liabilities
Fair Value of Derivative Instruments Location Amount Location Amount
Derivatives designated as hedging
instruments ....................................................
Foreign currency forward/option contracts ....... Other current assets $ 26 Other current liabilities $ 48
Commodity price swap contracts ..................... Other current assets
—
Other current liabilities 5
Interest rate swap contracts ............................. Other assets 39 Other liabilities —
Total derivatives designated as hedging
instruments ...........................................
$ 65 $ 53
Derivatives not designated as hedging
instruments ....................................................
Foreign currency forward/option contracts ....... Other current assets $ 12 Other current liabilities $ 34
Total derivatives not designated as
hedging instruments ............................
$ 12 $ 34
Total derivative instruments .............................
$ 77 $ 87
Additional information with respect to the fair value of derivative instruments is included in Note 13.
Currency Effects
Currency Effects: 3M estimates that year-on-year currency effects, including hedging impacts, increased net income
attributable to 3M by approximately $154 million in 2011 and increased net income attributable to 3M by
approximately $15 million in 2010. This estimate includes the effect of translating profits from local currencies into
U.S. dollars; the impact of currency fluctuations on the transfer of goods between 3M operations in the United States
and abroad; and transaction gains and losses, including derivative instruments designed to reduce foreign currency
exchange rate risks and the negative impact of swapping Venezuelan bolivars into U.S. dollars. 3M estimates that
year-on-year derivative and other transaction gains and losses had an immaterial impact on net income attributable
to 3M in 2011 and decreased net income attributable to 3M by approximately $115 million in 2010.