3M 2011 Annual Report Download - page 41
Download and view the complete annual report
Please find page 41 of the 2011 3M annual report below. You can navigate through the pages in the report by either clicking on the pages listed below, or by using the keyword search tool below to find specific information within the annual report.-
 1
1 -
2
-
3
-
4
-
5
-
6
-
7
-
8
-
9
-
10
-
11
-
12
-
13
-
14
-
15
-
16
-
17
-
18
-
19
-
20
-
21
-
22
-
23
-
24
-
25
-
26
-
27
-
28
-
29
-
30
-
 31
31 -
 32
32 -
 33
33 -
 34
34 -
 35
35 -
 36
36 -
 37
37 -
 38
38 -
 39
39 -
 40
40 -
 41
41 -
 42
42 -
 43
43 -
 44
44 -
 45
45 -
 46
46 -
 47
47 -
 48
48 -
 49
49 -
 50
50 -
 51
51 -
52
-
53
-
54
-
55
-
56
-
57
-
58
-
59
-
60
-
61
-
62
-
63
-
64
-
65
-
66
-
67
-
68
-
69
-
70
-
71
-
72
-
73
-
74
-
75
-
76
-
77
-
78
-
79
-
80
-
81
-
82
-
83
-
84
-
85
-
86
-
87
-
88
-
89
-
90
-
91
-
92
-
93
-
94
-
95
-
96
-
97
-
98
-
99
-
100
-
101
-
102
-
103
-
104
-
105
-
106
-
107
-
108
-
109
-
110
-
111
-
112
-
113
-
114
-
115
-
116
-
117
-
118
-
119
-
120
-
121
-
122
-
123
-
124
-
125
-
126
-
127
-
128
-
129
-
130
-
131
-
132
 |
 |

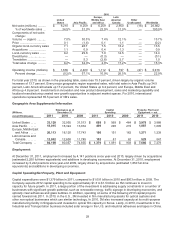
35
combined index (defined as quarterly net sales — fourth quarter at year-end — multiplied by four, divided by ending
net accounts receivable plus inventory less accounts payable) was 5.0 at December 31, 2011, a decline from 5.3 at
December 31, 2010. Receivables increased $252 million, or 7.0 percent, compared with December 31, 2010, with
higher December 2011 sales compared to December 2010 sales contributing to this increase. In addition,
acquisitions increased accounts receivable by $106 million and currency translation decreased accounts receivable
by $59 million. Inventories increased $261 million, or 8.3 percent, compared with December 31, 2010. The inventory
increases are partially attributable to the increase in demand in 2011. In addition, acquisitions increased inventories
by $128 million year-on-year, while currency translation decreased inventories by $18 million. Accounts payable
decreased $19 million compared with December 31, 2010. Acquisitions increased the accounts payable balance by
$68 million, while currency translation decreased accounts payable by $5 million.
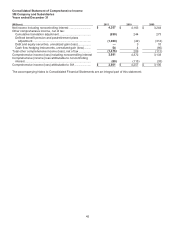
Cash flows from operating, investing and financing activities are provided in the tables that follow. Individual amounts
in the Consolidated Statement of Cash Flows exclude the effects of acquisitions, divestitures and exchange rate
impacts on cash and cash equivalents, which are presented separately in the cash flows. Thus, the amounts
presented in the following operating, investing and financing activities tables reflect changes in balances from period
to period adjusted for these effects.
The Company revised the amounts previously presented for cash used in investing activities and cash used in
financing activities during 2010 by $63 million. This revision related to purchases of additional shares (noncontrolling
interest) of non-wholly owned consolidated subsidiaries. These immaterial revisions increased cash used in financing
activities and decreased cash used in investing activities.
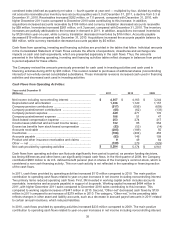
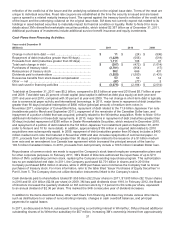
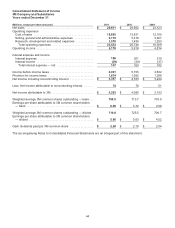
Cash Flows from Operating Activities:
Y
ears ended December 31
(Millions) 2011 2010 2009
Net income including noncontrolling interest .......................... $ 4,357
$ 4,163 $ 3,244
Depreciation and amortization ................................................ 1,236
1,120 1,157
Company pension contributions .............................................. (517 ) (556) (659 )
Company postretirement contributions ................................... (65 ) (62) (133 )
Company pension expense ..................................................... 449
271 176
Company postretirement expense .......................................... 106
51 47
Stock-based compensation expense ...................................... 253
274 217
Income taxes (deferred and accrued income taxes) ............... 132
85 554
Excess tax benefits from stock-based compensation ............. (53 ) (53) (14 )
A
ccounts receivable ................................................................ (205 ) (189) 55
Inventories ............................................................................... (196 ) (404) 453
A
ccounts payable .................................................................... (83 ) 146 109
Product and other insurance receivables and claims ............. 9
49 64
Other — net ............................................................................. (139 ) 279 (329 )
Net cash provided by operating activities ................................ $ 5,284
$ 5,174 $ 4,941
Cash flows from operating activities can fluctuate significantly from period to period, as pension funding decisions,
tax timing differences and other items can significantly impact cash flows. In the third quarter of 2009, the Company
contributed $600 million to its U.S. defined benefit pension plan in shares of the Company’s common stock, which is
considered a non-cash financing activity. This non-cash activity is not reflected in the operating or financing section
of the cash flows.
In 2011, cash flows provided by operating activities increased $110 million compared to 2010. The main positive
contribution to operating cash flows related to year-on-year increases in net income including noncontrolling interest.
Two primary items reduced operating cash flows. First, 3M invested in working capital (which includes accounts
receivable, inventories and accounts payable) in support of its growth. Working capital increased $484 million in
2011, with higher December 2011 sales compared to December 2010 sales contributing to this increase. This
compared to working capital increases of $447 million in 2010. Second, “Other-net” decreased cash flows by $139
million in 2011 compared to an increase of $279 million in 2010. The category, “Other-net,” in the preceding table
reflects changes in other asset and liability accounts, such as a decrease in accrued payroll amounts in 2011 related
to certain annual incentives, which reduced liabilities.
In 2010, cash flows provided by operating activities increased $233 million compared to 2009. The main positive
contribution to operating cash flows related to year-on-year increases in net income including noncontrolling interest.