3M 2011 Annual Report Download - page 91
Download and view the complete annual report
Please find page 91 of the 2011 3M annual report below. You can navigate through the pages in the report by either clicking on the pages listed below, or by using the keyword search tool below to find specific information within the annual report.-
 1
1 -
2
-
3
-
4
-
5
-
6
-
7
-
8
-
9
-
10
-
11
-
12
-
13
-
14
-
15
-
16
-
17
-
18
-
19
-
20
-
21
-
22
-
23
-
24
-
25
-
26
-
27
-
28
-
29
-
30
-
31
-
32
-
33
-
34
-
35
-
36
-
37
-
38
-
39
-
40
-
41
-
42
-
43
-
44
-
45
-
46
-
47
-
48
-
49
-
50
-
51
-
52
-
53
-
54
-
55
-
56
-
57
-
58
-
59
-
60
-
61
-
62
-
63
-
64
-
65
-
66
-
67
-
68
-
69
-
70
-
71
-
72
-
73
-
74
-
75
-
76
-
77
-
78
-
79
-
80
-
 81
81 -
 82
82 -
 83
83 -
 84
84 -
 85
85 -
 86
86 -
 87
87 -
 88
88 -
 89
89 -
 90
90 -
 91
91 -
 92
92 -
 93
93 -
 94
94 -
 95
95 -
 96
96 -
 97
97 -
 98
98 -
 99
99 -
 100
100 -
 101
101 -
102
-
103
-
104
-
105
-
106
-
107
-
108
-
109
-
110
-
111
-
112
-
113
-
114
-
115
-
116
-
117
-
118
-
119
-
120
-
121
-
122
-
123
-
124
-
125
-
126
-
127
-
128
-
129
-
130
-
131
-
132
 |
 |

85
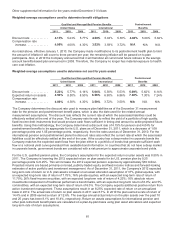
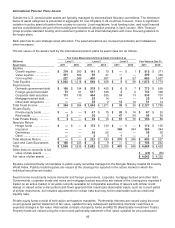
International Pension Plans Assets
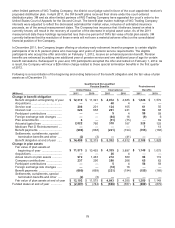
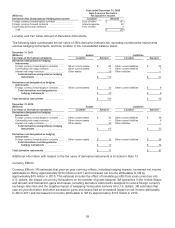
Outside the U.S., pension plan assets are typically managed by decentralized fiduciary committees. The disclosure
below of asset categories is presented in aggregate for over 65 plans in 24 countries; however, there is significant
variation in policy asset allocation from country to country. Local regulations, local funding rules, and local financial
and tax considerations are part of the funding and investment allocation process in each country. 3M’s Treasury
group provides standard funding and investment guidance to all international plans with more focused guidance to
the larger plans.
Each plan has its own strategic asset allocation. The asset allocations are reviewed periodically and rebalanced
when necessary.
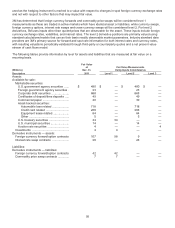
The fair values of the assets held by the international pension plans by asset class are as follows:
Fair Value Measurements Using Inputs Considered as
(Millions) Level 1 Level 2 Level 3 Fair Value at Dec 31,
Asset Class 2011 2010 2011 2010 2011 2010 2011 2010
Equities .................................
Growth equities ................ $ 374
$ 300
$ 141
$ 70
$
—
$ 1 $ 515
$ 371
Value equities .................. 401 369
98
27
—
—
499
396
Core equities .................... 227 549
430
361 5
97 662
1,007
Total Equities ....................... $ 1,002
$ 1,218
$ 669
$ 458
$ 5
$ 98 $ 1,676
$ 1,774
Fixed Income ........................
Domestic government debt
$ 188
$ 194
$ 579
$ 455
$ 6
$ 7 $ 773
$ 656
Foreign government debt 93 51
647
345 2
2
742
398
Corporate debt securities 113 139
404
555 19 13 536
707
Mortgage backed debt .....
—
—
25
14
—
—
25
14
Other debt obligations .....
—
—
39
2
12 12 51
14
Total Fixed Income .............. $ 394
$ 384
$ 1,694
$ 1,371
$ 39
$ 34 $ 2,127
$ 1,789
Private Equity .......................
Private equity funds ......... $ —
$ —
$ 47
$ 15
$ 20
$ 14 $ 67
$ 29
Real estate ....................... 3
—
38
3
47 56 88
59
Total Private Equity ............. $ 3
$ —
$ 85
$ 18
$ 67
$ 70 $ 155
$ 88
A
bsolute Return ....................
Hedge funds .................... $ —
$ —
$ 172
$ 130
$
—
$ — $ 172
$ 130
Insurance .........................
—
—
—
—
369 344 369
344
Derivatives .......................
—
—
58
50
—
—
58
50
Other ................................
—
—
2
3
1
—
3
3
Total Absolute Return .......... $ —
$ —
$ 232
$ 183
$ 370
$ 344 $ 602
$ 527
Cash and Cash Equivalents $ 106
$ 233
$ 2
$ 9
$
—
$ — $ 108
$ 242
Total ..................................... $ 1,505
$ 1,835
$ 2,682
$ 2,039
$ 481
$ 546 $ 4,668
$ 4,420
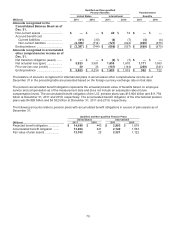
Other items to reconcile to fair
value of plan assets ......... $ (25 ) $ (65 )
Fair value of plan assets ..... $ 4,643
$ 4,355
Equities consist primarily of mandates in public equity securities managed to the Morgan Stanley Capital All Country
World Index. Publicly traded equities are valued at the closing price reported in the active market in which the
individual securities are traded.
Fixed Income investments include domestic and foreign government, corporate, mortgage backed and other debt.
Governments, corporate bonds and notes and mortgage backed securities are valued at the closing price reported if
traded on an active market or at yields currently available on comparable securities of issuers with similar credit
ratings or valued under a discounted cash flows approach that maximizes observable inputs, such as current yields
of similar instruments, but includes adjustments for certain risks that may not be observable such as credit and
liquidity risks.
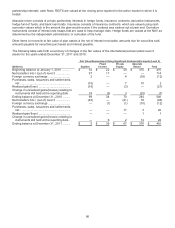
Private equity funds consist of both active and passive mandates. Partnership interests are valued using the most
recent general partner statement of fair value, updated for any subsequent partnership interests’ cash flows or
expected changes in fair value. Real estate consists of property funds and REITS (Real Estate Investment Trusts).
Property funds are valued using the most recent partnership statement of fair value, updated for any subsequent
85
International Pension Plans Assets
Outside the U.S., pension plan assets are typically managed by decentralized fiduciary committees. The disclosure
below of asset categories is presented in aggregate for over 65 plans in 24 countries; however, there is significant
variation in policy asset allocation from country to country. Local regulations, local funding rules, and local financial
and tax considerations are part of the funding and investment allocation process in each country. 3M’s Treasury
group provides standard funding and investment guidance to all international plans with more focused guidance to
the larger plans.
Each plan has its own strategic asset allocation. The asset allocations are reviewed periodically and rebalanced
when necessary.
The fair values of the assets held by the international pension plans by asset class are as follows:
Fair Value Measurements Using Inputs Considered as
(Millions) Level 1 Level 2 Level 3 Fair Value at Dec 31,
Asset Class 2011 2010 2011 2010 2011 2010 2011 2010
Equities
Growth equities ................ $ 374
$ 300
$ 141
$ 70
$ —
$ 1 $ 515
$ 371
Value equities .................. 401
369 98
27
—
—
499
396
Core equities .................... 227
549 430
361 5
97 662
1,007
Total Equities ....................... $ 1,002
$ 1,218
$ 669
$ 458
$ 5
$ 98 $ 1,676
$ 1,774
Fixed Income
Domestic government debt
$ 188
$ 194
$ 579
$ 455
$ 6
$ 7 $ 773
$ 656
Foreign government debt 93
51 647
345 2
2
742
398
Corporate debt securities 113
139 404
555 19 13 536
707
Mortgage backed debt ..... —
—
25
14
—
—
25
14
Other debt obligations ..... —
—
39
2
12 12 51
14
Total Fixed Income .............. $ 394
$ 384
$ 1,694
$ 1,371
$ 39
$ 34 $ 2,127
$ 1,789
Private Equity
Private equity funds ......... $ —
$ —
$ 47
$ 15
$ 20
$ 14 $ 67
$ 29
Real estate ....................... 3
—
38
3
47 56 88
59
Total Private Equity ............. $ 3
$ —
$ 85
$ 18
$ 67
$ 70 $ 155
$ 88
A
bsolute Return
Hedge funds .................... $ —
$ —
$ 172
$ 130
$ —
$ — $ 172
$ 130
Insurance ......................... —
—
—
—
369 344 369
344
Derivatives ....................... —
—
58
50
—
—
58
50
Other ................................ —
—
2
3
1
—
3
3
Total Absolute Return .......... $ —
$ —
$ 232
$ 183
$ 370
$ 344 $ 602
$ 527
Cash and Cash Equivalents $ 106
$ 233
$ 2
$ 9
$ —
$ — $ 108
$ 242
Total ..................................... $ 1,505
$ 1,835
$ 2,682
$ 2,039
$ 481
$ 546 $ 4,668
$ 4,420
Other items to reconcile to fair
value of plan assets ......... $ (25 ) $ (65 )
Fair value of plan assets ..... $ 4,643
$ 4,355
Equities consist primarily of mandates in public equity securities managed to the Morgan Stanley Capital All Country
World Index. Publicly traded equities are valued at the closing price reported in the active market in which the
individual securities are traded.
Fixed Income investments include domestic and foreign government, corporate, mortgage backed and other debt.
Governments, corporate bonds and notes and mortgage backed securities are valued at the closing price reported if
traded on an active market or at yields currently available on comparable securities of issuers with similar credit
ratings or valued under a discounted cash flows approach that maximizes observable inputs, such as current yields
of similar instruments, but includes adjustments for certain risks that may not be observable such as credit and
liquidity risks.
Private equity funds consist of both active and passive mandates. Partnership interests are valued using the most
recent general partner statement of fair value, updated for any subsequent partnership interests’ cash flows or
expected changes in fair value. Real estate consists of property funds and REITS (Real Estate Investment Trusts).
Property funds are valued using the most recent partnership statement of fair value, updated for any subsequent