3M 2011 Annual Report Download - page 119
Download and view the complete annual report
Please find page 119 of the 2011 3M annual report below. You can navigate through the pages in the report by either clicking on the pages listed below, or by using the keyword search tool below to find specific information within the annual report.-
 1
1 -
2
-
3
-
4
-
5
-
6
-
7
-
8
-
9
-
10
-
11
-
12
-
13
-
14
-
15
-
16
-
17
-
18
-
19
-
20
-
21
-
22
-
23
-
24
-
25
-
26
-
27
-
28
-
29
-
30
-
31
-
32
-
33
-
34
-
35
-
36
-
37
-
38
-
39
-
40
-
41
-
42
-
43
-
44
-
45
-
46
-
47
-
48
-
49
-
50
-
51
-
52
-
53
-
54
-
55
-
56
-
57
-
58
-
59
-
60
-
61
-
62
-
63
-
64
-
65
-
66
-
67
-
68
-
69
-
70
-
71
-
72
-
73
-
74
-
75
-
76
-
77
-
78
-
79
-
80
-
81
-
82
-
83
-
84
-
85
-
86
-
87
-
88
-
89
-
90
-
91
-
92
-
93
-
94
-
95
-
96
-
97
-
98
-
99
-
100
-
101
-
102
-
103
-
104
-
105
-
106
-
107
-
108
-
 109
109 -
 110
110 -
 111
111 -
 112
112 -
 113
113 -
 114
114 -
 115
115 -
 116
116 -
 117
117 -
 118
118 -
 119
119 -
 120
120 -
 121
121 -
 122
122 -
 123
123 -
 124
124 -
 125
125 -
 126
126 -
 127
127 -
 128
128 -
 129
129 -
130
-
131
-
132
 |
 |

113
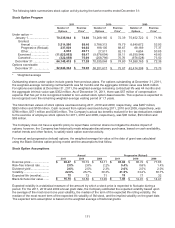
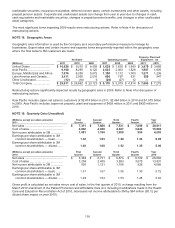
The following table summarizes performance share activity during the twelve months ended December 31:
2011 2010
Number of Grant Date Number of Grant Date
Awards Fair Value* Awards Fair Value*
Undistributed balance —
As of January 1 ......................... 760,645 $ 73.99
— $ —
Granted ................................. 415,024 84.58
370,575 74.46
Distributed ............................. (206,410 ) 72.77
— —
Performance change ............. (39,323 ) 82.10
396,390 73.55
Forfeited ................................ (51,064 ) 80.20
(6,320 ) 73.92
As of December 31 ................... 878,872 $ 78.55
760,645 $ 73.99
* Weighted average
As of December 31, 2011, there was $11 million of compensation expense that has yet to be recognized related to
performance shares. This expense is expected to be recognized over the remaining weighted-average earnings
period of 0.8 years. The total fair value of performance shares that were distributed during the twelve-month periods
ended December 31, 2011 was $18 million, while none were distributed during 2010. The Company’s actual tax
benefits realized for the tax deductions related to the distribution of performance shares was $5 million for 2011, with
no tax benefits realized in 2010.
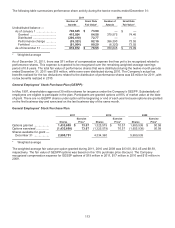
*HQHUDO(PSOR\HHV¶6WRFN3XUFKDVH3ODQ*(633
In May 1997, shareholders approved 30 million shares for issuance under the Company’s GESPP. Substantially all
employees are eligible to participate in the plan. Participants are granted options at 85% of market value at the date
of grant. There are no GESPP shares under option at the beginning or end of each year because options are granted
on the first business day and exercised on the last business day of the same month.
General Employees’ Stock Purchase Plan
2011 2010 2009
Exercise Exercise Exercise
Shares Price* Shares Price* Shares Price*
Options granted ................... 1,433,609 $ 73.67 1,325,579 $ 70.57 1,655,936 $ 50.58
Options exercised ................ (1,433,609) 73.67
(1,325,579 ) 70.57 (1,655,936) 50.58
Shares available for grant —
December 31 ................... 2,900,751 4,334,360 5,659,939
* Weighted average
The weighted-average fair value per option granted during 2011, 2010 and 2009 was $13.00, $12.45 and $8.93,
respectively. The fair value of GESPP options was based on the 15% purchase price discount. The Company
recognized compensation expense for GESSP options of $19 million in 2011, $17 million in 2010 and $15 million in
2009.