3M 2011 Annual Report Download - page 117
Download and view the complete annual report
Please find page 117 of the 2011 3M annual report below. You can navigate through the pages in the report by either clicking on the pages listed below, or by using the keyword search tool below to find specific information within the annual report.-
 1
1 -
2
-
3
-
4
-
5
-
6
-
7
-
8
-
9
-
10
-
11
-
12
-
13
-
14
-
15
-
16
-
17
-
18
-
19
-
20
-
21
-
22
-
23
-
24
-
25
-
26
-
27
-
28
-
29
-
30
-
31
-
32
-
33
-
34
-
35
-
36
-
37
-
38
-
39
-
40
-
41
-
42
-
43
-
44
-
45
-
46
-
47
-
48
-
49
-
50
-
51
-
52
-
53
-
54
-
55
-
56
-
57
-
58
-
59
-
60
-
61
-
62
-
63
-
64
-
65
-
66
-
67
-
68
-
69
-
70
-
71
-
72
-
73
-
74
-
75
-
76
-
77
-
78
-
79
-
80
-
81
-
82
-
83
-
84
-
85
-
86
-
87
-
88
-
89
-
90
-
91
-
92
-
93
-
94
-
95
-
96
-
97
-
98
-
99
-
100
-
101
-
102
-
103
-
104
-
105
-
106
-
 107
107 -
 108
108 -
 109
109 -
 110
110 -
 111
111 -
 112
112 -
 113
113 -
 114
114 -
 115
115 -
 116
116 -
 117
117 -
 118
118 -
 119
119 -
 120
120 -
 121
121 -
 122
122 -
 123
123 -
 124
124 -
 125
125 -
 126
126 -
 127
127 -
128
-
129
-
130
-
131
-
132
 |
 |

111
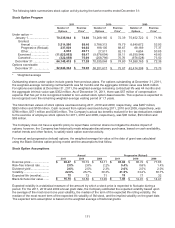
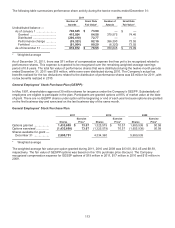
The following table summarizes stock option activity during the twelve months ended December 31:
Stock Option Program
2011 2010 2009
Number of Exercise Number of Exercise Number of Exercise
Options Price* Options Price* Options Price*
Under option —
January 1 .......................... 70,335,044 $ 74.80
74,268,165 $ 72.39 75,452,722 $ 71.96
Granted:
Annual ....................... 5,514,500 89.46
5,788,313 78.79 6,649,672 53.93
Progressive (Re load) . 237,839 94.02
188,105 88.67 68,189 77.37
Other .......................... 8,953 86.71
27,911 82.13 4,654 50.85
Exercised ...................... (11,625,863) 68.47
(9,678,654 ) 59.11 (6,930,544) 49.83
Canceled ....................... (322,058) 75.09
(258,796 ) 70.76 (976,528) 73.50
December 31 .................... 64,148,415 $ 77.28
70,335,044 $ 74.80 74,268,165 $ 72.39
Options exercisable
December 31 .................... 52,644,364 $ 76.90
58,201,617 $ 75.87 62,414,398 $ 73.73
* Weighted average
Outstanding shares under option include grants from previous plans. For options outstanding at December 31, 2011,
the weighted-average remaining contractual life was 54 months and the aggregate intrinsic value was $426 million.
For options exercisable at December 31, 2011, the weighted-average remaining contractual life was 44 months and
the aggregate intrinsic value was $352 million. As of December 31, 2011, there was $57 million of compensation
expense that has yet to be recognized related to non-vested stock option-based awards. This expense is expected to
be recognized over the remaining weighted-average vesting period of 1.7 years.
The total intrinsic values of stock options exercised during 2011, 2010 and 2009, respectively, was $287 million,
$263 million and $108 million. Cash received from options exercised during 2011, 2010 and 2009, respectively, was
$796 million, $571 million and $345 million. The Company’s actual tax benefits realized for the tax deductions related
to the exercise of employee stock options for 2011, 2010 and 2009, respectively, was $96 million, $93 million and
$38 million.
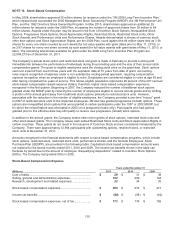
The Company does not have a specific policy to repurchase common shares to mitigate the dilutive impact of
options; however, the Company has historically made adequate discretionary purchases, based on cash availability,
market trends and other factors, to satisfy stock option exercise activity.
For annual and progressive (reload) options, the weighted average fair value at the date of grant was calculated
using the Black-Scholes option-pricing model and the assumptions that follow.
Stock Option Assumptions
Annual Progressive (Reload)
2011 2010 2009 2011 2010 2009
Exercise price ....................... $ 89.47
$ 78.72 $ 54.11
$ 93.94
$ 86.72 $ 77.83
Risk-free interest rate ........... 2.8 % 2.8 % 2.2 % 0.4 % 0.6 % 1.4 %
Dividend yield ....................... 2.6 % 2.5 % 2.3 % 2.6 % 2.5 % 2.0 %
Volatility ................................ 22.0 % 25.7 % 30.3 % 21.5 % 33.2 % 30.7 %
Expected life (months).......... 72
72 71
15
17 32
Black-Scholes fair value ....... $ 16.10
$ 16.50 $ 13.00
$ 7.49
$ 12.01 $ 14.47
Expected volatility is a statistical measure of the amount by which a stock price is expected to fluctuate during a
period. For the 2011, 2010 and 2009 annual grant date, the Company estimated the expected volatility based upon
the average of the most recent one year volatility, the median of the term of the expected life rolling volatility, the
median of the most recent term of the expected life volatility of 3M stock, and the implied volatility on the grant date.
The expected term assumption is based on the weighted average of historical grants.