3M 2011 Annual Report Download - page 37
Download and view the complete annual report
Please find page 37 of the 2011 3M annual report below. You can navigate through the pages in the report by either clicking on the pages listed below, or by using the keyword search tool below to find specific information within the annual report.-
 1
1 -
2
-
3
-
4
-
5
-
6
-
7
-
8
-
9
-
10
-
11
-
12
-
13
-
14
-
15
-
16
-
17
-
18
-
19
-
20
-
21
-
22
-
23
-
24
-
25
-
26
-
 27
27 -
 28
28 -
 29
29 -
 30
30 -
 31
31 -
 32
32 -
 33
33 -
 34
34 -
 35
35 -
 36
36 -
 37
37 -
 38
38 -
 39
39 -
 40
40 -
 41
41 -
 42
42 -
 43
43 -
 44
44 -
 45
45 -
 46
46 -
 47
47 -
48
-
49
-
50
-
51
-
52
-
53
-
54
-
55
-
56
-
57
-
58
-
59
-
60
-
61
-
62
-
63
-
64
-
65
-
66
-
67
-
68
-
69
-
70
-
71
-
72
-
73
-
74
-
75
-
76
-
77
-
78
-
79
-
80
-
81
-
82
-
83
-
84
-
85
-
86
-
87
-
88
-
89
-
90
-
91
-
92
-
93
-
94
-
95
-
96
-
97
-
98
-
99
-
100
-
101
-
102
-
103
-
104
-
105
-
106
-
107
-
108
-
109
-
110
-
111
-
112
-
113
-
114
-
115
-
116
-
117
-
118
-
119
-
120
-
121
-
122
-
123
-
124
-
125
-
126
-
127
-
128
-
129
-
130
-
131
-
132
 |
 |

31
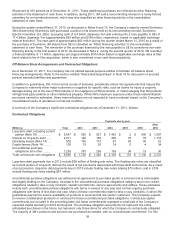
A significant element in determining the Company’s pension expense in accordance with ASC 715 is the expected
return on plan assets, which is based on historical results for similar allocations among asset classes. For the U.S.
pension plan, the 2012 expected long-term rate of return on an annualized basis for 2012 is 8.25%, a 0.25%
decrease from 2011. Refer to Note 11 for information on how the 2012 rate was determined. Return on assets
assumptions for international pension and other post-retirement benefit plans are calculated on a plan-by-plan basis
using plan asset allocations and expected long-term rate of return assumptions. The weighted average expected
return for the international pension plan is 6.38% for 2012, compared to 6.58% for 2011.
For the year ended December 31, 2011, the Company recognized total consolidated pre-tax pension and
postretirement expense (after settlements, curtailments and special termination benefits) of $555 million, up from
$322 million in 2010. Pension and postretirement expense (before settlements, curtailments and special termination
benefits) is anticipated to increase to approximately $644 million in 2012, an increase of $89 million compared to
2011. For the pension plans, holding all other factors constant, a 0.25 percentage point increase/decrease in the
expected long-term rate of return on plan assets would decrease/increase 2012 pension expense by approximately
$30 million for U.S. pension plans and approximately $12 million for international pension plans. Also, holding all
other factors constant, a 0.25 percentage point increase in the discount rate used to measure plan liabilities would
decrease 2012 pension expense by approximately $37 million for U.S. pension plans and approximately $16 million
for international pension plans. In addition, a 0.25 percentage point decrease in the discount rate used to measure
plan liabilities would increase 2012 pension expense by approximately $39 million for U.S. pension plans and
approximately $19 million for international pension plans.
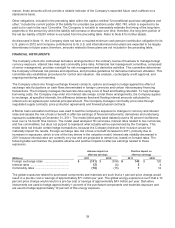
Asset Impairments:
As of December 31, 2011, net property, plant and equipment totaled $7.7 billion and net identifiable intangible assets
totaled $1.9 billion. Management makes estimates and assumptions in preparing the consolidated financial
statements for which actual results will emerge over long periods of time. This includes the recoverability of long-lived
assets employed in the business, including assets of acquired businesses. These estimates and assumptions are
closely monitored by management and periodically adjusted as circumstances warrant. For instance, expected asset
lives may be shortened or an impairment recorded based on a change in the expected use of the asset or
performance of the related asset group. Impairments recorded in 2009 related to restructuring actions are discussed
in Note 4.
In June 2009, 3M’s Security Systems Division (within the Safety, Security and Protection Services business
segment) was notified that the UK government decided to award the production of its passports to a competitor upon
the expiration of 3M’s existing UK passport contracts in October 2010. As a result of this event, in June 2009, 3M
tested the long lived assets associated with the UK passport activity for recoverability and also reassessed their
remaining useful lives. In addition, 3M tested goodwill for impairment at the reporting unit (Security Systems Division)
level. The result of the June 2009 test of recoverability of long lived assets associated with the UK passport activity
indicated that the asset grouping’s carrying amount of approximately $54 million (before impairment) exceeded the
remaining expected cash flows. Accordingly, 3M recorded a non-cash impairment charge of approximately $13
million in the second quarter of 2009 to write these assets down to their fair value. In addition, accelerated
depreciation/amortization was taken over the period June 2009 through the date of expiration of the contract based
on a reassessment of the remaining expected useful life of these assets.
3M goodwill totaled approximately $7.0 billion as of December 31, 2011. 3M’s annual goodwill impairment testing is
performed in the fourth quarter of each year. Impairment testing for goodwill is done at a reporting unit level, with all
goodwill assigned to a reporting unit. Reporting units are one level below the business segment level (3M has six
business segments at December 31, 2011), but can be combined when reporting units within the same segment
have similar economic characteristics. At 3M, reporting units generally correspond to a division. 3M did not combine
any of its reporting units for impairment testing.
An impairment loss generally would be recognized when the carrying amount of the reporting unit’s net assets
exceeds the estimated fair value of the reporting unit. The estimated fair value of a reporting unit is determined using
earnings for the reporting unit multiplied by a price/earnings ratio for comparable industry groups, or by using a
discounted cash flow analysis. 3M typically uses the price/earnings ratio approach for stable and growing businesses
that have a long history and track record of generating positive operating income and cash flows. 3M uses the
discounted cash flow approach for start-up, loss position and declining businesses, but also uses discounted cash
flow as an additional tool for businesses that may be growing at a slower rate than planned due to economic or other
conditions.