3M 2011 Annual Report Download - page 21
Download and view the complete annual report
Please find page 21 of the 2011 3M annual report below. You can navigate through the pages in the report by either clicking on the pages listed below, or by using the keyword search tool below to find specific information within the annual report.-
 1
1 -
2
-
3
-
4
-
5
-
6
-
7
-
8
-
9
-
10
-
 11
11 -
 12
12 -
 13
13 -
 14
14 -
 15
15 -
 16
16 -
 17
17 -
 18
18 -
 19
19 -
 20
20 -
 21
21 -
 22
22 -
 23
23 -
 24
24 -
 25
25 -
 26
26 -
 27
27 -
 28
28 -
 29
29 -
 30
30 -
 31
31 -
32
-
33
-
34
-
35
-
36
-
37
-
38
-
39
-
40
-
41
-
42
-
43
-
44
-
45
-
46
-
47
-
48
-
49
-
50
-
51
-
52
-
53
-
54
-
55
-
56
-
57
-
58
-
59
-
60
-
61
-
62
-
63
-
64
-
65
-
66
-
67
-
68
-
69
-
70
-
71
-
72
-
73
-
74
-
75
-
76
-
77
-
78
-
79
-
80
-
81
-
82
-
83
-
84
-
85
-
86
-
87
-
88
-
89
-
90
-
91
-
92
-
93
-
94
-
95
-
96
-
97
-
98
-
99
-
100
-
101
-
102
-
103
-
104
-
105
-
106
-
107
-
108
-
109
-
110
-
111
-
112
-
113
-
114
-
115
-
116
-
117
-
118
-
119
-
120
-
121
-
122
-
123
-
124
-
125
-
126
-
127
-
128
-
129
-
130
-
131
-
132
 |
 |

15
impairments have been recorded. In addition, 3M is not aware of any significant issues related to these natural
disasters concerning inventory, customer receivables, lease terminations, environmental exposures, guarantees,
indemnifications, debt covenant compliance, or significant tax issues. 3M does have certain insurance coverage
which limits its exposure and resulted in some initial recovery in the fourth quarter of 2011 (as discussed above).
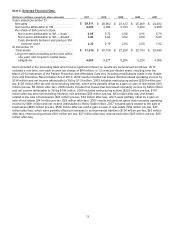
Sales in 2011 increased 11.1 percent to $29.6 billion, led by Industrial and Transportation, Safety, Security and
Protection Services, and Health Care. All major geographic regions showed improvement, led by Latin
America/Canada. The increase in global sales reflected improved market penetration and new product flow along
with significant growth in important end-markets such as general industrial and personal safety. Net income
attributable to 3M was $4.283 billion, or $5.96 per diluted share in 2011, compared to $4.085 billion, or $5.63 per
diluted share, in 2010 (including the first-quarter 2010 special item discussed below).
Fourth-quarter 2010 sales grew nearly 10 percent to $6.7 billion, despite negative comparisons from H1N1 and
moderating sales growth in optical films for LCD TVs. Sales growth was broad-based, with organic sales volumes
expanding in all businesses, led by an 18.7 percent increase in Electro and Communications and a 14.7 percent
increase in Display and Graphics. Geographically, organic sales volume was strongest in Asia Pacific at 18.1 percent
and Latin America at 12.2 percent. Net income attributable to 3M in the fourth quarter of 2010 was $928 million, or
$1.28 per diluted shares, compared to $935 million, or $1.30 per diluted share, in the fourth quarter of 2009. Fourth-
quarter income was penalized by year-on-year H1N1-related comparisons, increases in raw material costs, and
investments to accelerate future growth. 3M invested in research and development, sales and marketing (including
advertising and merchandising investments), and also incurred acquisition-related costs in the fourth quarter. 3M
made several large fourth-quarter 2010 acquisitions, including Arizant Inc., Attenti Holdings S.A. and Cogent Inc.
For total year 2010, the Company posted 2010 sales of $26.7 billion, up 15.3 percent. During the year, 3M invested
significantly to improve long-term growth. For example, research, development and related expenses of $1.4 billion
helped to drive innovation and new product sales. 3M also accelerated sales and marketing investments in high-
growth markets to help secure future growth. All businesses posted positive organic volume growth, led by Display
and Graphics at 26.5 percent, Electro and Communications at 26.0 percent, and Industrial and Transportation at 16.6
percent. Including special items (discussed below), net income attributable to 3M in 2010 was $4.085 billion, or $5.63
per diluted share, compared to $3.193 billion or $4.52 per diluted share, in 2009.
In 2010, 3M recorded a one-time, non-cash income tax charge of $84 million, or 12 cents per diluted share, resulting
from the March 2010 enactment of the Patient Protection and Affordable Care Act, including modifications made in
the Health Care and Education Reconciliation Act of 2010. Refer to the special items discussion at the end of this
overview section for more detail.
3M has been aggressively restructuring the company since early 2008 and continued this effort through the third
quarter of 2009, with these restructuring actions and exit activities resulting in an aggregate reduction of
approximately 6,400 positions. The related net restructuring charges and other special items reduced net income
attributable to 3M for year 2009 by $119 million, or $0.17 per diluted share. Refer to the special items discussion at
the end of this overview section for more detail. These restructuring actions and exit activities resulted in savings of
almost $400 million in 2009 and additional incremental savings of more than $150 million in 2010, with the majority of
2010’s benefit in the first half of the year. In addition, 3M amended its policy regarding banked vacation in 2009,
which added more than $100 million to operating income in 2009, with a benefit of approximately $80 million in 2010.
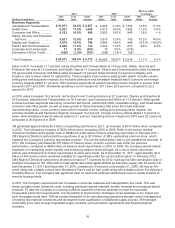
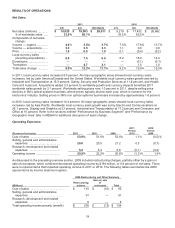
The following table contains sales and operating income results by business segment for the years ended
December 31, 2011 and 2010. In addition to the discussion below, refer to the section entitled “Performance by
Business Segment” and “Performance by Geographic Area” later in MD&A for a more detailed discussion of the
sales and income results of the Company and its respective business segments (including Corporate and
Unallocated). Refer to Note 17 for additional information on business segments, including Elimination of Dual Credit.