3M 2011 Annual Report Download - page 35
Download and view the complete annual report
Please find page 35 of the 2011 3M annual report below. You can navigate through the pages in the report by either clicking on the pages listed below, or by using the keyword search tool below to find specific information within the annual report.-
 1
1 -
2
-
3
-
4
-
5
-
6
-
7
-
8
-
9
-
10
-
11
-
12
-
13
-
14
-
15
-
16
-
17
-
18
-
19
-
20
-
21
-
22
-
23
-
24
-
 25
25 -
 26
26 -
 27
27 -
 28
28 -
 29
29 -
 30
30 -
 31
31 -
 32
32 -
 33
33 -
 34
34 -
 35
35 -
 36
36 -
 37
37 -
 38
38 -
 39
39 -
 40
40 -
 41
41 -
 42
42 -
 43
43 -
 44
44 -
 45
45 -
46
-
47
-
48
-
49
-
50
-
51
-
52
-
53
-
54
-
55
-
56
-
57
-
58
-
59
-
60
-
61
-
62
-
63
-
64
-
65
-
66
-
67
-
68
-
69
-
70
-
71
-
72
-
73
-
74
-
75
-
76
-
77
-
78
-
79
-
80
-
81
-
82
-
83
-
84
-
85
-
86
-
87
-
88
-
89
-
90
-
91
-
92
-
93
-
94
-
95
-
96
-
97
-
98
-
99
-
100
-
101
-
102
-
103
-
104
-
105
-
106
-
107
-
108
-
109
-
110
-
111
-
112
-
113
-
114
-
115
-
116
-
117
-
118
-
119
-
120
-
121
-
122
-
123
-
124
-
125
-
126
-
127
-
128
-
129
-
130
-
131
-
132
 |
 |

29
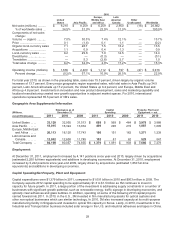
2010
United
States Asia Pacific
Europe,
Middle East
and Africa
Latin
America/
Canada
Other
Unallocated Worldwide
Net sales (millions) .......... $ 9,210 $ 8,259 $ 6,259 $ 2,950 $ (16) $ 26,662
% of worldwide sales ... 34.5% 31.0 % 23.5 % 11.0 %
—
100.0 %
Components of net sales
change:
Volume — organic ........... 7.0% 30.3 % 7.4 % 12.1 %
—
13.7 %
Price ................................ 0.1 (1.6 ) 0.1 1.1
—
(0.2 )
Organic local-currency sales 7.1 28.7 7.5 13.2
—
13.5
A
cquisitions ..................... 1.1 0.9 0.4 1.3
—
0.9
Local-currency sales ....... 8.2 29.6 7.9 14.5
—
14.4
Divestitures ......................
—
— (0.3 ) —
—
(0.1 )
Translation .......................
—
5.3 (2.8 ) 2.7
—
1.0
Total sales change .......... 8.2% 34.9 % 4.8 % 17.2 %
—
15.3 %
Operating income (millions) $ 1,636 $ 2,400 $ 1,112 $ 797 $ (27) $ 5,918
Percent change ............ (0.2)% 57.1 % 10.9 % 26.5 %
—
22.9 %
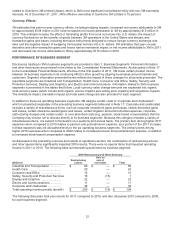
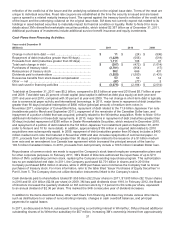
For total year 2010, as shown in the preceding table, sales rose 15.3 percent, driven largely by organic volume
increases of 13.7 percent. Every major geographic region expanded sales, with total sales in Asia Pacific up 34.9
percent, Latin America/Canada up 17.2 percent, the United States up 8.2 percent, and Europe, Middle East and
Africa up 4.8 percent. Investments in innovation and new product development, sales and marketing capability and
localized manufacturing created new growth opportunities in adjacent market spaces. For 2010, international
operations represented 65.5 percent of 3M’s sales.
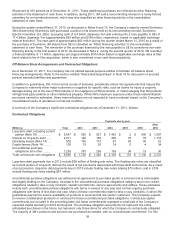
Geographic Area Supplemental Information
(Millions, Employees as of
December 31,
Capital
Spending
Property, Plant and
Equipment — net
except Employees) 2011 2010 2009 2011 2010 2009 2011 2010
United States .... 33,128
32,955 31,513
$ 688 $ 569 $ 464 $ 3,979
$ 3,888
A
sia Pacific ..... 18,015
16,324 13,834
409 290 215
1,887
1,605
Europe, Middle East
and Africa ..... 20,113
18,120 17,743
180 151 162
1,271
1,239
Latin America and
Canada ....... 12,942
12,658 11,745
102 81 62
529
547
Total Company . . 84,198
80,057 74,835
$ 1,379 $ 1,091 $ 903 $ 7,666
$ 7,279
Employment:
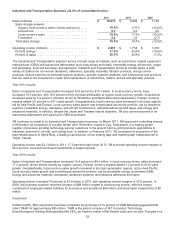
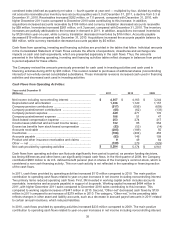
At December 31, 2011, employment increased by 4,141 positions since year-end 2010, largely driven by acquisitions
(estimated 2,250 full-time equivalents) and additions in developing economies. At December 31, 2010, employment
increased by 5,222 positions since year-end 2009, largely driven by acquisitions (estimated 1,850 full-time
equivalents) and additions in developing economies.
Capital Spending/Net Property, Plant and Equipment:
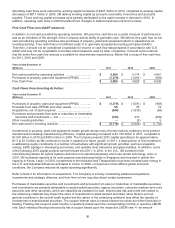
Capital expenditures were $1.379 billion in 2011, compared to $1.091 billion in 2010 and $903 million in 2009. The
Company expects 2012 capital spending to be approximately $1.3 to $1.5 billion as 3M continues to invest in
capacity for future growth. In 2011, a large portion of the investment is addressing supply constraints in a number of
businesses with significant growth potential, such as renewable energy, traffic signage in developing economies, and
optically clear adhesives and glass bubbles. In addition, spending on some of the following 2010 capital projects
carried forward into 2011. In 2010, in the U.S., 3M invested in film manufacturing assets for optical systems and
other non-optical businesses which use similar technology. In 2010, 3M also increased capacity at its multi-purpose
manufacturing facility in Singapore and invested in optical film capacity in Korea. Lastly, in 2010, investments in the
Industrial and Transportation business included solar energy in the U.S. and industrial adhesives and tapes in China.