Tesco 2012 Annual Report Download - page 78
Download and view the complete annual report
Please find page 78 of the 2012 Tesco annual report below. You can navigate through the pages in the report by either clicking on the pages listed below, or by using the keyword search tool below to find specific information within the annual report.-
 1
1 -
2
-
3
-
4
-
5
-
6
-
7
-
8
-
9
-
10
-
11
-
12
-
13
-
14
-
15
-
16
-
17
-
18
-
19
-
20
-
21
-
22
-
23
-
24
-
25
-
26
-
27
-
28
-
29
-
30
-
31
-
32
-
33
-
34
-
35
-
36
-
37
-
38
-
39
-
40
-
41
-
42
-
43
-
44
-
45
-
46
-
47
-
48
-
49
-
50
-
51
-
52
-
53
-
54
-
55
-
56
-
57
-
58
-
59
-
60
-
61
-
62
-
63
-
64
-
65
-
66
-
67
-
 68
68 -
 69
69 -
 70
70 -
 71
71 -
 72
72 -
 73
73 -
 74
74 -
 75
75 -
 76
76 -
 77
77 -
 78
78 -
 79
79 -
 80
80 -
 81
81 -
 82
82 -
 83
83 -
 84
84 -
 85
85 -
 86
86 -
 87
87 -
 88
88 -
89
-
90
-
91
-
92
-
93
-
94
-
95
-
96
-
97
-
98
-
99
-
100
-
101
-
102
-
103
-
104
-
105
-
106
-
107
-
108
-
109
-
110
-
111
-
112
-
113
-
114
-
115
-
116
-
117
-
118
-
119
-
120
-
121
-
122
-
123
-
124
-
125
-
126
-
127
-
128
-
129
-
130
-
131
-
132
-
133
-
134
-
135
-
136
-
137
-
138
-
139
-
140
-
141
-
142
-
143
-
144
-
145
-
146
-
147
-
148
-
149
-
150
-
151
-
152
-
153
-
154
-
155
-
156
-
157
-
158
 |
 |

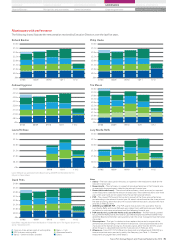
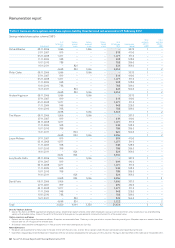
Aligning pay with performance
The following charts illustrate performance at Tesco against key performance indicators over the past five years.
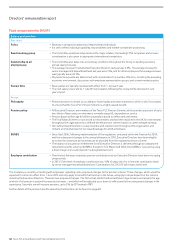
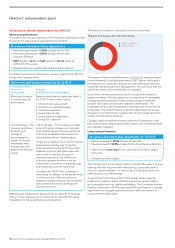
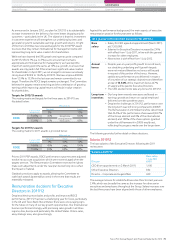
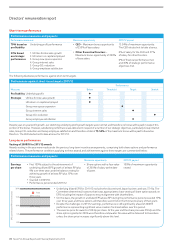
Directors’ remuneration report
£0m
£500m
£1,000m
£1,500m
£2,000m
£2,500m
£3,000m
£3,500m
£4,000m
£4,500m
11/1210/1109/1008/0907/08
Underlying profit before tax – continuing operations
0.0%
2.0%
4.0%
6.0%
8.0%
10.0%
12.0%
14.0%
11/1210/1109/1008/0907/08
Return on capital employed (‘ROCE’)
0p
5p
10p
15p
20p
25p
30p
35p
40p
11/1210/1109/1008/0907/08
Underlying diluted earnings per share – continuing operations
60
70
80
90
100
110
120
Feb 12Feb 11Feb 10Feb 09Feb 08Feb 07
Total Shareholder Return (‘TSR’)
FTSE 100
Te s c o
Value of £100 invested 23 February 2007
The graph above shows a comparison between the Total Shareholder Return (‘TSR’) for the
Company’s shares for the five-year period to 25 February 2012, and the TSR for the companies
comprising the FTSE 100 over the same period. This index has been selected to provide an
established and broad-based comparator group of retail and non-retail companies.
For further details in relation to the numbers set out in the charts above please see the Five year record on page 152.
74 Tesco PLC Annual Report and Financial Statements 2012