Tesco 2012 Annual Report Download - page 140
Download and view the complete annual report
Please find page 140 of the 2012 Tesco annual report below. You can navigate through the pages in the report by either clicking on the pages listed below, or by using the keyword search tool below to find specific information within the annual report.-
 1
1 -
2
-
3
-
4
-
5
-
6
-
7
-
8
-
9
-
10
-
11
-
12
-
13
-
14
-
15
-
16
-
17
-
18
-
19
-
20
-
21
-
22
-
23
-
24
-
25
-
26
-
27
-
28
-
29
-
30
-
31
-
32
-
33
-
34
-
35
-
36
-
37
-
38
-
39
-
40
-
41
-
42
-
43
-
44
-
45
-
46
-
47
-
48
-
49
-
50
-
51
-
52
-
53
-
54
-
55
-
56
-
57
-
58
-
59
-
60
-
61
-
62
-
63
-
64
-
65
-
66
-
67
-
68
-
69
-
70
-
71
-
72
-
73
-
74
-
75
-
76
-
77
-
78
-
79
-
80
-
81
-
82
-
83
-
84
-
85
-
86
-
87
-
88
-
89
-
90
-
91
-
92
-
93
-
94
-
95
-
96
-
97
-
98
-
99
-
100
-
101
-
102
-
103
-
104
-
105
-
106
-
107
-
108
-
109
-
110
-
111
-
112
-
113
-
114
-
115
-
116
-
117
-
118
-
119
-
120
-
121
-
122
-
123
-
124
-
125
-
126
-
127
-
128
-
129
-
 130
130 -
 131
131 -
 132
132 -
 133
133 -
 134
134 -
 135
135 -
 136
136 -
 137
137 -
 138
138 -
 139
139 -
 140
140 -
 141
141 -
 142
142 -
 143
143 -
 144
144 -
 145
145 -
 146
146 -
 147
147 -
 148
148 -
 149
149 -
 150
150 -
151
-
152
-
153
-
154
-
155
-
156
-
157
-
158
 |
 |

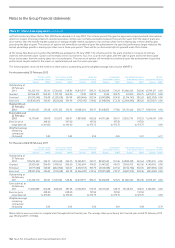
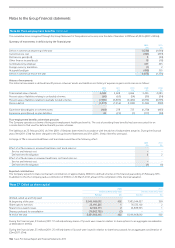
Notes to the Group financial statements
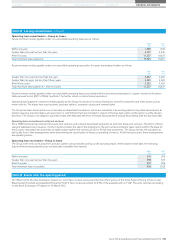
Note 26 Post-employment benefits continued
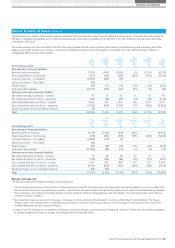
The cumulative losses recognised through the Group Statement of Comprehensive Income since the date of transition to IFRS are £1,037m (2011: £539m).
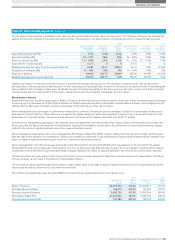
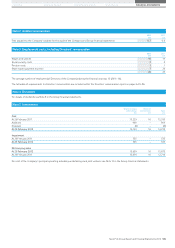
Summary of movements in deficit during the financial year
2012
£m
2011
£m
Deficit in schemes at beginning of the year (1,356) (1,840)
Current service cost (495) (499)
Past service gain/(cost) 3 (29)
Other finance income/(cost) 18 (18)
Contributions by employer 457 433
Foreign currency translation (1) 2
Actuarial (loss)/gain (498) 595
Deficit in schemes at end of the year (1,872) (1,356)
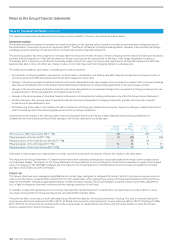
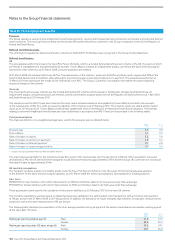
History of movements
The historical movement in defined benefit pension schemes’ assets and liabilities and history of experience gains and losses are as follows:
2012
£m
2011
£m
2010
£m
2009
£m
2008
£m
Total market value of assets 6,169 5,608 4,696 3,420 4,089
Present value of liabilities relating to unfunded schemes (60) (65) (54) (39) (34)
Present value of liabilities relating to partially funded schemes (7,981) (6,899) (6,482) (4,875) (4,893)
Pension deficit (1,872) (1,356) (1,840) (1,494) (838)
Experience (losses)/gains on scheme assets (168) 278 733 (1,270) (465)
Experience gains/(losses) on plan liabilities 43 (25) (1) (117) (20)
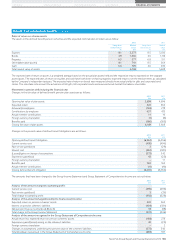
Post-employment benefits other than pensions
The Company operates a scheme offering post-employment healthcare benefits. The cost of providing these benefits has been accounted for on
a similar basis to that used for defined benefit pension schemes.
The liability as at 25 February 2012 of £11m (2011: £12m) was determined in accordance with the advice of independent actuaries. During the financial
year, £1m (2011: £1m) has been charged to the Group Income Statement and £1m (2011: £1m) of benefits were paid.
A change of 1% in assumed healthcare cost trend rates would have the following effect:
2012
£m
2011
£m
Effect of a 1% increase in assumed healthcare cost trend rates on:
Service and interest cost ––
Defined benefit obligation 22
Effect of a 1% decrease in assumed healthcare cost trend rates on:
Service and interest cost ––
Defined benefit obligation (1) (1)
Expected contributions
The Company expects to make normal cash contributions of approximately £486m to defined schemes in the financial year ending 23 February 2013.
Inaddition to this the Company paid a contribution of £180m on 30 March 2012, ahead of the completion of the triennial valuation.
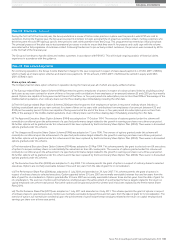
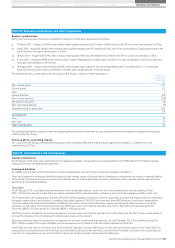
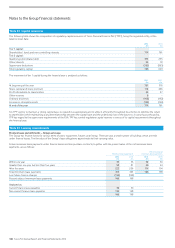
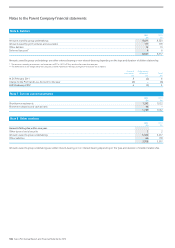
Note 27 Called up share capital
2012 2011
Ordinary shares of 5p each Ordinary shares of 5p each
Number £m Number £m
Allotted, called up and fully paid:
At beginning of the year 8,046,468,092 402 7,985,044,057 399
Share options exercises 23,490,825 1 36,535,102 2
Share bonus awards issues 32,656,313 2 24,888,933 1
Shares purchased for cancellation (70,802,785) (3) ––
At end of the year 8,031,812,445 402 8,046,468,092 402
During the financial year, 23 million (2011: 37 million) ordinary shares of 5p each were issued in relation to share options for an aggregate consideration
of £69m (2011: £97m).
During the financial year, 33 million (2011: 25 million) shares of 5p each were issued in relation to share bonus awards for an aggregate consideration of
£2m (2011: £1m).
136 Tesco PLC Annual Report and Financial Statements 2012