Tesco 2012 Annual Report Download - page 2
Download and view the complete annual report
Please find page 2 of the 2012 Tesco annual report below. You can navigate through the pages in the report by either clicking on the pages listed below, or by using the keyword search tool below to find specific information within the annual report.-
 1
1 -
 2
2 -
 3
3 -
 4
4 -
 5
5 -
 6
6 -
 7
7 -
 8
8 -
 9
9 -
 10
10 -
 11
11 -
 12
12 -
 13
13 -
14
-
15
-
16
-
17
-
18
-
19
-
20
-
21
-
22
-
23
-
24
-
25
-
26
-
27
-
28
-
29
-
30
-
31
-
32
-
33
-
34
-
35
-
36
-
37
-
38
-
39
-
40
-
41
-
42
-
43
-
44
-
45
-
46
-
47
-
48
-
49
-
50
-
51
-
52
-
53
-
54
-
55
-
56
-
57
-
58
-
59
-
60
-
61
-
62
-
63
-
64
-
65
-
66
-
67
-
68
-
69
-
70
-
71
-
72
-
73
-
74
-
75
-
76
-
77
-
78
-
79
-
80
-
81
-
82
-
83
-
84
-
85
-
86
-
87
-
88
-
89
-
90
-
91
-
92
-
93
-
94
-
95
-
96
-
97
-
98
-
99
-
100
-
101
-
102
-
103
-
104
-
105
-
106
-
107
-
108
-
109
-
110
-
111
-
112
-
113
-
114
-
115
-
116
-
117
-
118
-
119
-
120
-
121
-
122
-
123
-
124
-
125
-
126
-
127
-
128
-
129
-
130
-
131
-
132
-
133
-
134
-
135
-
136
-
137
-
138
-
139
-
140
-
141
-
142
-
143
-
144
-
145
-
146
-
147
-
148
-
149
-
150
-
151
-
152
-
153
-
154
-
155
-
156
-
157
-
158
 |
 |
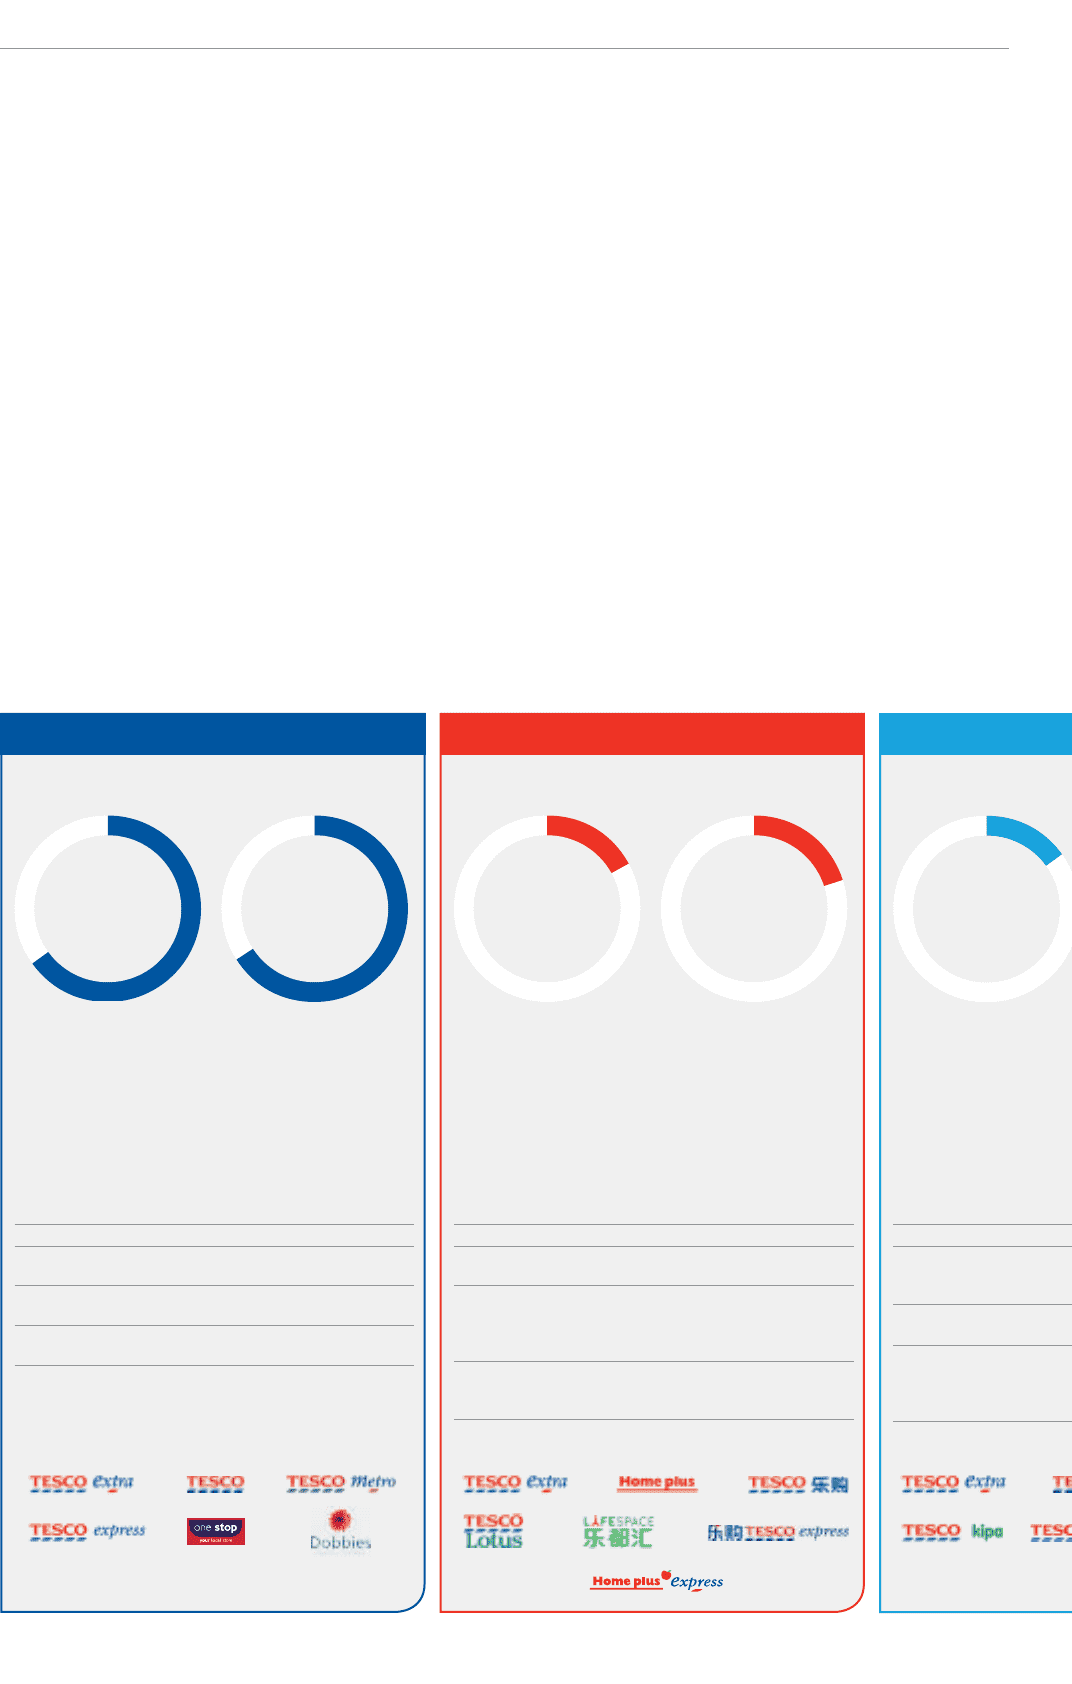
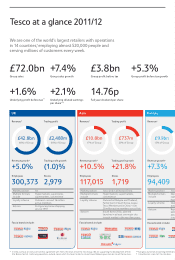
Tesco at a glance 2011/12
We are one of the world’s largest retailers with operations
in 14 countries*
, employing almost 520,000 people and
serving millions of customers every week.
£72.0bn
Group sales
+5.3%
Group profit before tax growth
£3.8bn
Group profit before tax
+7.4%
Group sales growth
+2.1%
Underlying diluted earnings
per share**†
14.76p
Full year dividend per share
+1.6%
Underlying profit before tax**
* In India, we have an exclusive franchise agreement with Trent, the retail arm of the Tata Group. We are supporting the development of their
Star Bazaar format. Continuing operations exclude Japan which has been treated as discontinued following our decision to sell the business.
** See glossary for full accounting definitions.
† Calculated on a constant tax rate basis.
Asia
Revenue growth±
+10.5%
Employees
117,015
Stores
1,719
Trading profit growth
+21.8%
Revenue±Trading profit
Market position 1st or 2nd in all except China
Multiple formats
include
Hypermarkets, supermarkets,
convenience
Loyalty scheme Clubcard in Malaysia and Thailand,
Family Card in South Korea, Legou
Tesco Membercard in China – over
20 million active members across Asia
dotcom South Korea 2002, planned
launches in at least one major city
in each market in the next few years
Fascia brands include:
£10.8bn
17% of Group
£737m
20% of Group
Europe
Revenue growth±
+7. 3%
Employees
94,409
Revenue±
Market position 1st o
Multiple formats
include
Dep
supe
hype
Loyalty scheme Club
activ
dotcom Repu
2011
2012
in ea
Fascia brands include:
£9.9bn
15% of Group
UK
Revenue growth±
+5.0%
Employees
300,373
Stores
2,979
Trading profit growth
(1.0)%
Revenue±Trading profit
Market position 1st
Multiple formats
include
Hypermarkets, superstores,
supermarkets, convenience
Loyalty scheme Clubcard – around 16 million
active members
dotcom First grocery home shopping
service1997
Fascia brands include:
£42.8bn
66% of Group
£2,480m
66% of Group