Tesco 2012 Annual Report Download - page 38
Download and view the complete annual report
Please find page 38 of the 2012 Tesco annual report below. You can navigate through the pages in the report by either clicking on the pages listed below, or by using the keyword search tool below to find specific information within the annual report.-
 1
1 -
2
-
3
-
4
-
5
-
6
-
7
-
8
-
9
-
10
-
11
-
12
-
13
-
14
-
15
-
16
-
17
-
18
-
19
-
20
-
21
-
22
-
23
-
24
-
25
-
26
-
27
-
 28
28 -
 29
29 -
 30
30 -
 31
31 -
 32
32 -
 33
33 -
 34
34 -
 35
35 -
 36
36 -
 37
37 -
 38
38 -
 39
39 -
 40
40 -
 41
41 -
 42
42 -
 43
43 -
 44
44 -
 45
45 -
 46
46 -
 47
47 -
 48
48 -
49
-
50
-
51
-
52
-
53
-
54
-
55
-
56
-
57
-
58
-
59
-
60
-
61
-
62
-
63
-
64
-
65
-
66
-
67
-
68
-
69
-
70
-
71
-
72
-
73
-
74
-
75
-
76
-
77
-
78
-
79
-
80
-
81
-
82
-
83
-
84
-
85
-
86
-
87
-
88
-
89
-
90
-
91
-
92
-
93
-
94
-
95
-
96
-
97
-
98
-
99
-
100
-
101
-
102
-
103
-
104
-
105
-
106
-
107
-
108
-
109
-
110
-
111
-
112
-
113
-
114
-
115
-
116
-
117
-
118
-
119
-
120
-
121
-
122
-
123
-
124
-
125
-
126
-
127
-
128
-
129
-
130
-
131
-
132
-
133
-
134
-
135
-
136
-
137
-
138
-
139
-
140
-
141
-
142
-
143
-
144
-
145
-
146
-
147
-
148
-
149
-
150
-
151
-
152
-
153
-
154
-
155
-
156
-
157
-
158
 |
 |

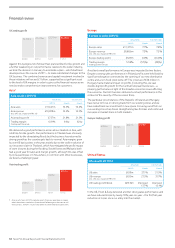
08/09
£2,309m £2,413m £2,480m
09/10 11/12
UK trading profit
£2,504m
10/11
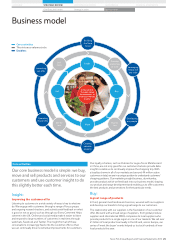
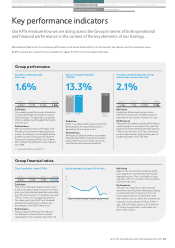
Against this background of slower than planned like-for-like growth and
a further weakening in our performance relative to the wider industry,
we took the decision in January to accelerate a plan – which had been
developed over the course of 2011 – to make substantial changes to the
UK business. The combined revenue and capital investment involved in
these initiatives will exceed £1 billion, supported by a significant reset
to the level of UK margins in order to give us the financial resources we
need to make comprehensive improvements for customers.
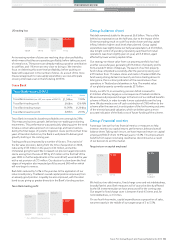
Asia†
Asia results 2011/12
Actual rates Constant rates
2011/12 Growth Growth
Asia sales £11,627m 10.5% 10.4%
Asia revenue
(exc. VAT, exc. impact of IFRIC 13)
£10,828m 10.5% 10.3%
Asia trading profit £737m 21.8% 21.5%
Trading margin
(trading profit/revenue)
6.81% 64bp 62bp
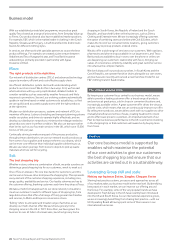
We delivered a good performance across all our markets in Asia, with
solid like-for-like growth. Our performance in Thailand was obviously
impacted by the devastating floods but the business has returned to
strong growth as the country gets back to normal. Asia margins grew
by over 60 basis points in the year, mainly due to the swift resolution of
our insurance claim in Thailand, which has mitigated the profit impact
of store closures during the flooding. South Korea and Malaysia both
had a good year for sales and margin growth, although this was offset
by increased losses in China where, in common with other businesses,
we faced a challenging year.
08/09
£355m
£440m
£737m
09/10 11/12
Asia trading profit
£605m
10/11
† Asia results from 2011/12 exclude results from our operation in Japan
which have been treated as discontinued following our decision to sell
the business. 2010/11 results have been re-presented to be consistent.
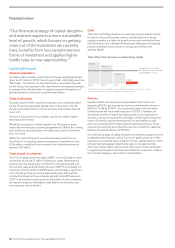
Europe
Europe results 2011/12
Actual rates Constant rates
2011/12 Growth Growth
Europe sales £11, 371m 7.7% 7. 8%
Europe revenue
(exc. VAT, exc. impact of IFRIC 13)
£9,866m 7.3% 7.5%
Europe trading profit £529m 0.4% (0.4)%
Trading margin
(trading profit/revenue)
5.36% (37)bp (42)bp
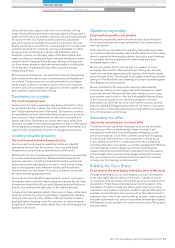
A resilient overall performance in Europe was impacted by two factors.
Despite a strong sales performance in Poland, profits were held back by
significant disruption connected to the opening of our new distribution
centre and a non-food stock write-off. The crisis tax of £38 million in
Hungary had a material impact on profits. Excluding this, we saw
double-digit profit growth for the Central European businesses – a
pleasing performance in light of the broader economic issues affecting
the eurozone. Our Irish business delivered a robust performance in the
context of the severity of the recession there.
The particular circumstances of the Republic of Ireland and Hungary
have led us to focus on driving trade from our existing stores and we
have scaled back our investment in new space. Focusing our efforts on
our existing stores has driven strengthening like-for-likes and continued
increases in market share in both markets.
08/09
£496m £474m
£529m
09/10 11/12
Europe trading profit
£527m
10/11
United States
US results 2011/12
Actual rates Constant rates
2011/12 Growth Growth
US sales £638m 27.1% 31.5%
US revenue
(exc. VAT, exc. impact of IFRIC 13)
£630m 27.3% 31.7%
US trading profit/(loss) £(153)m Improved
17.7%
Improved
15.1%
In the US, Fresh & Easy delivered another strong sales performance and
we have reduced losses by nearly 18% year-on-year – the first full-year
reduction in losses since our entry into the market.
Financial review
34 Tesco PLC Annual Report and Financial Statements 2012