Tesco 2012 Annual Report Download - page 106
Download and view the complete annual report
Please find page 106 of the 2012 Tesco annual report below. You can navigate through the pages in the report by either clicking on the pages listed below, or by using the keyword search tool below to find specific information within the annual report.-
 1
1 -
2
-
3
-
4
-
5
-
6
-
7
-
8
-
9
-
10
-
11
-
12
-
13
-
14
-
15
-
16
-
17
-
18
-
19
-
20
-
21
-
22
-
23
-
24
-
25
-
26
-
27
-
28
-
29
-
30
-
31
-
32
-
33
-
34
-
35
-
36
-
37
-
38
-
39
-
40
-
41
-
42
-
43
-
44
-
45
-
46
-
47
-
48
-
49
-
50
-
51
-
52
-
53
-
54
-
55
-
56
-
57
-
58
-
59
-
60
-
61
-
62
-
63
-
64
-
65
-
66
-
67
-
68
-
69
-
70
-
71
-
72
-
73
-
74
-
75
-
76
-
77
-
78
-
79
-
80
-
81
-
82
-
83
-
84
-
85
-
86
-
87
-
88
-
89
-
90
-
91
-
92
-
93
-
94
-
95
-
 96
96 -
 97
97 -
 98
98 -
 99
99 -
 100
100 -
 101
101 -
 102
102 -
 103
103 -
 104
104 -
 105
105 -
 106
106 -
 107
107 -
 108
108 -
 109
109 -
 110
110 -
 111
111 -
 112
112 -
 113
113 -
 114
114 -
 115
115 -
 116
116 -
117
-
118
-
119
-
120
-
121
-
122
-
123
-
124
-
125
-
126
-
127
-
128
-
129
-
130
-
131
-
132
-
133
-
134
-
135
-
136
-
137
-
138
-
139
-
140
-
141
-
142
-
143
-
144
-
145
-
146
-
147
-
148
-
149
-
150
-
151
-
152
-
153
-
154
-
155
-
156
-
157
-
158
 |
 |

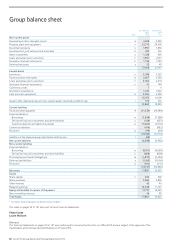
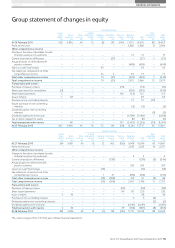
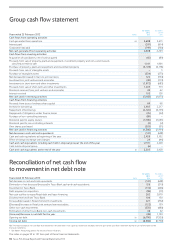
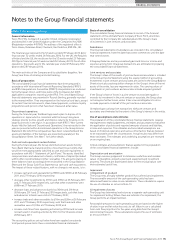
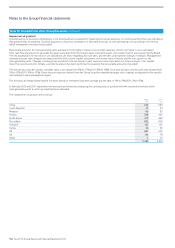
Notes to the Group financial statements
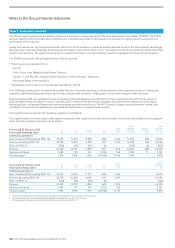
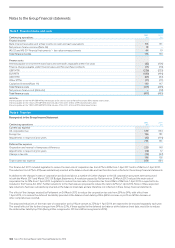
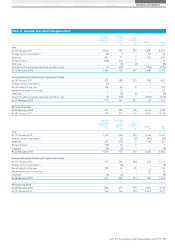
Note 2 Segmental reporting
The Group’s reporting segments are determined based on the Group’s internal reporting to the Chief Operating Decision Maker (‘CODM’). The CODM
has been determined to be the Executive Committee as it is primarily responsible for the allocation of resources to segments and the assessment of
performance of the segments.
During the financial year, the Group announced its decision to sell its operations in Japan (previously reported as part of the Asia segment). Accordingly,
these operations have been treated as discontinued as described in more detail in Notes 1 and 7. The segment results do not include any amounts for these
discontinued operations. The segment assets and other segment information sets out continuing operations separately from discontinued operations.
The CODM now considers the principal activities of the Group to be:
Retailing and associated activities in:
– the UK;
– Asia – China, India, Malaysia, South Korea, Thailand;
– Europe – Czech Republic, Hungary, Poland, Republic of Ireland, Slovakia, Turkey; and
– the United States of America (‘US’)
Retail banking and insurance services through Tesco Bank in the UK.
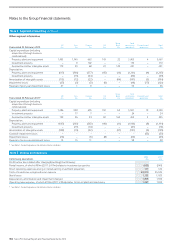
The CODM uses trading profit, as reviewed at monthly Executive Committee meetings, as the key measure of the segments’ results as it reflects the
segments’ underlying trading performance for the financial year under evaluation. Trading profit is a consistent measure within the Group.
Segment trading profit is an adjusted measure of operating profit and measures the performance of each segment before profits/losses arising on
property-related items, the impact on leases of annual uplifts in rent and rent-free periods, intangible asset amortisation charges and costs arising
from acquisitions, and goodwill impairment and restructuring and other one-off costs. The IAS 19 pension charge is replaced with the ‘normal’ cash
contributions for pensions. An adjustment is also made for the fair value of customer loyalty awards.
Inter-segment revenue between the operating segments is not material.
The segment results, the reconciliation of the segment measures to the respective statutory items included in the Group Income Statement, the segment
assets and other segment information are as follows:
Year ended 25 February 2012
At constant exchange rates*UK
£m
Asia
£m
Europe
£m
US
£m
Tesco
Bank
£m
Total at
constant
exchange
£m
Foreign
exchange
£m
Total
at actual
exchange
£m
Continuing operations
Sales including VAT (excluding IFRIC 13) 47,355 11,615 11,380 660 1,044 72,054 (19) 72,035
Revenue (excluding IFRIC 13) 42,798 10,816 9,878 652 1,044 65,188 (22) 65,166
Effect of IFRIC 13 (550) (35) (39) (2) – (626) (1) (627)
Revenue 42,248 10,781 9,839 650 1,044 64,562 (23) 64,539
Trading profit/(loss) 2,480 735 525 (158) 168 3,750 11 3,761
Trading margin†5.8% 6.8% 5.3% (24.2%) 16.1% 5.8% 5.8%
Year ended 25 February 2012
At actual exchange rates** UK
£m
Asia
£m
Europe
£m
US
£m
Tesco
Bank
£m
Total
at actual
exchange
£m
Continuing operations
Sales including VAT (excluding IFRIC 13) 47,355 11,627 11,371 638 1,044 72,035
Revenue (excluding IFRIC 13) 42,798 10,828 9,866 630 1,044 65,166
Effect of IFRIC 13 (550) (35) (40) (2) – (627)
Revenue 42,248 10,793 9,826 628 1,044 64,539
Trading profit/(loss) 2,480 737 529 (153) 168 3,761
Trading margin†5.8% 6.8% 5.4% (24.3%) 16.1% 5.8%
* Constant exchange rates are the average actual periodic exchange rates for the previous financial year.
** Actual exchange rates are the average actual periodic exchange rates for that financial year.
† Trading margin is based on revenue excluding the accounting impact of IFRIC 13.
102 Tesco PLC Annual Report and Financial Statements 2012