Tesco 2012 Annual Report Download - page 121
Download and view the complete annual report
Please find page 121 of the 2012 Tesco annual report below. You can navigate through the pages in the report by either clicking on the pages listed below, or by using the keyword search tool below to find specific information within the annual report.-
 1
1 -
2
-
3
-
4
-
5
-
6
-
7
-
8
-
9
-
10
-
11
-
12
-
13
-
14
-
15
-
16
-
17
-
18
-
19
-
20
-
21
-
22
-
23
-
24
-
25
-
26
-
27
-
28
-
29
-
30
-
31
-
32
-
33
-
34
-
35
-
36
-
37
-
38
-
39
-
40
-
41
-
42
-
43
-
44
-
45
-
46
-
47
-
48
-
49
-
50
-
51
-
52
-
53
-
54
-
55
-
56
-
57
-
58
-
59
-
60
-
61
-
62
-
63
-
64
-
65
-
66
-
67
-
68
-
69
-
70
-
71
-
72
-
73
-
74
-
75
-
76
-
77
-
78
-
79
-
80
-
81
-
82
-
83
-
84
-
85
-
86
-
87
-
88
-
89
-
90
-
91
-
92
-
93
-
94
-
95
-
96
-
97
-
98
-
99
-
100
-
101
-
102
-
103
-
104
-
105
-
106
-
107
-
108
-
109
-
110
-
 111
111 -
 112
112 -
 113
113 -
 114
114 -
 115
115 -
 116
116 -
 117
117 -
 118
118 -
 119
119 -
 120
120 -
 121
121 -
 122
122 -
 123
123 -
 124
124 -
 125
125 -
 126
126 -
 127
127 -
 128
128 -
 129
129 -
 130
130 -
 131
131 -
132
-
133
-
134
-
135
-
136
-
137
-
138
-
139
-
140
-
141
-
142
-
143
-
144
-
145
-
146
-
147
-
148
-
149
-
150
-
151
-
152
-
153
-
154
-
155
-
156
-
157
-
158
 |
 |

STRATEGIC REVIEW PERFORMANCE REVIEW GOVERNANCE FINANCIAL STATEMENTS
OVERVIEW
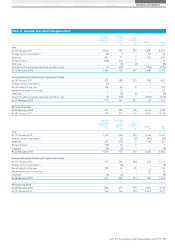
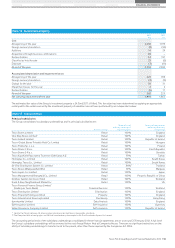
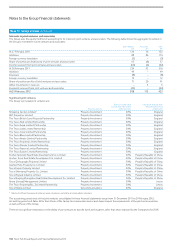
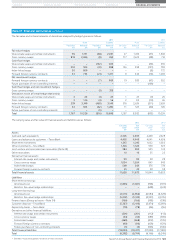
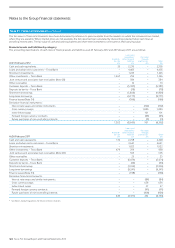
Note 13 Group entities continued
The share of the assets, liabilities, revenue and profit of the joint ventures, which are included in the Group financial statements, are as follows:
2012
£m
2011
£m
Non-current assets 3,173 2,720
Current assets 868 577
Current liabilities (2,180) (1,957)*
Non-current liabilities (1,678) (1,123)
Goodwill 7 7
Net assets 190 224
Cumulative unrecognised losses 118 –
Interests in joint ventures 308 224
Revenue 492 369
Profit for the year 71 65
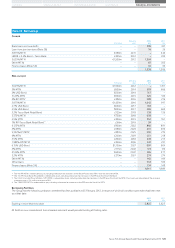
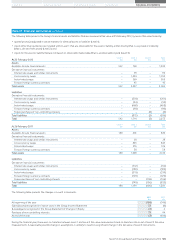
Associates
The Group’s principal associates are:
Business activity
Share of issued share capital,
loan capital and debt
securities
Country of incorporation
and principal country
of operation
Greenergy International Limited** Fuel Supplier 34.4% England
Tesco Underwriting Limited** Insurance 49.9% England
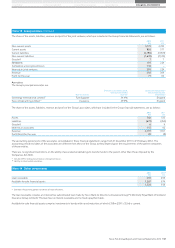
The share of the assets, liabilities, revenue and profit of the Group’s associates, which are included in the Group financial statements, are as follows:
2012
£m
2011
£m
Assets 782 535
Liabilities (673) (452)
Goodwill 6 9
Interests in associates 115 92
Revenue 3,791 1,551
Profit/(loss) for the year 20 (8)
The accounting period ends of the associates consolidated in these financial statements range from 31 December 2011 to 29 February 2012. The
accounting period end dates of the associates are different from those of the Group as they depend upon the requirements of the parent companies
of those entities.
There are no significant restrictions on the ability of associated undertakings to transfer funds to the parent, other than those imposed by the
Companies Act 2006.
* Includes £59m relating to cumulative unrecognised losses.
** Held by an intermediate subsidiary.
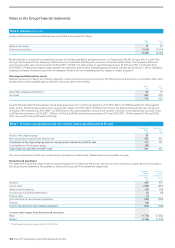
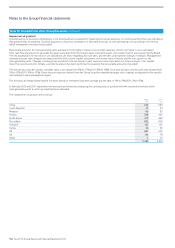
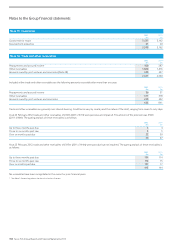
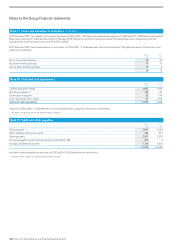
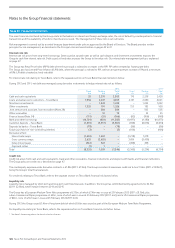
Note 14 Other investments
2012
£m
2011*
£m
Loan receivable 259 259
Available-for-sale financial assets 1,267 679
1,526 938
* See Note 1 Accounting policies for details of reclassifications.
The loan receivable includes an interest-free subordinated loan made by Tesco Bank to Direct Line Insurance Group Plc (formerly Royal Bank of Scotland
Insurance Group Limited). This loan has no interest receivable and no fixed repayment date.
Available-for-sale financial assets comprise investments in bonds with varied maturities of which £158m (2011: £32m) is current.
Tesco PLC Annual Report and Financial Statements 2012 117