Tesco 2012 Annual Report Download - page 39
Download and view the complete annual report
Please find page 39 of the 2012 Tesco annual report below. You can navigate through the pages in the report by either clicking on the pages listed below, or by using the keyword search tool below to find specific information within the annual report.-
 1
1 -
2
-
3
-
4
-
5
-
6
-
7
-
8
-
9
-
10
-
11
-
12
-
13
-
14
-
15
-
16
-
17
-
18
-
19
-
20
-
21
-
22
-
23
-
24
-
25
-
26
-
27
-
28
-
 29
29 -
 30
30 -
 31
31 -
 32
32 -
 33
33 -
 34
34 -
 35
35 -
 36
36 -
 37
37 -
 38
38 -
 39
39 -
 40
40 -
 41
41 -
 42
42 -
 43
43 -
 44
44 -
 45
45 -
 46
46 -
 47
47 -
 48
48 -
 49
49 -
50
-
51
-
52
-
53
-
54
-
55
-
56
-
57
-
58
-
59
-
60
-
61
-
62
-
63
-
64
-
65
-
66
-
67
-
68
-
69
-
70
-
71
-
72
-
73
-
74
-
75
-
76
-
77
-
78
-
79
-
80
-
81
-
82
-
83
-
84
-
85
-
86
-
87
-
88
-
89
-
90
-
91
-
92
-
93
-
94
-
95
-
96
-
97
-
98
-
99
-
100
-
101
-
102
-
103
-
104
-
105
-
106
-
107
-
108
-
109
-
110
-
111
-
112
-
113
-
114
-
115
-
116
-
117
-
118
-
119
-
120
-
121
-
122
-
123
-
124
-
125
-
126
-
127
-
128
-
129
-
130
-
131
-
132
-
133
-
134
-
135
-
136
-
137
-
138
-
139
-
140
-
141
-
142
-
143
-
144
-
145
-
146
-
147
-
148
-
149
-
150
-
151
-
152
-
153
-
154
-
155
-
156
-
157
-
158
 |
 |

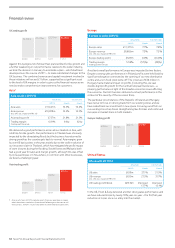
08/09
£(142)m £(165)m £(153)m
09/10 11/12
US trading loss
£(186)m
10/11
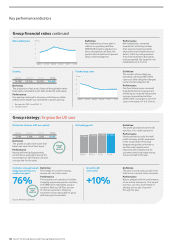
An increasing number of stores are reaching shop-door profitability,
which means that they are operating profitably, before taking account
of central costs. Thirty stores are already making a positive contribution
to cashflow, and 118 more are very close to doing so. We intend to
focus on delivering this store-level profitability, before pushing on
faster with expansion in the number of stores. As a result of this more
measured approach to new capital expenditure, we now anticipate
crossing into break-even in the US during 2013/14.
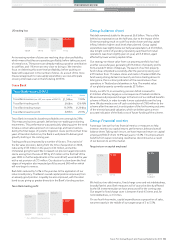
Tesco Bank
Tesco Bank results 2011/12
2011/12 Growth
Tesco Bank revenue (exc. VAT, exc. impact of IFRIC 13) £1,044m 13.6%
Tesco Bank trading profit £168m (36.4)%
Tesco Bank trading margin 16.09% (1,264)bp
Tesco Bank baseline profit £203m 29.3%
Tesco Bank increased its baseline profitability very strongly by 29%.
This measures business growth, before key non-trading provisioning
movements. This performance was particularly pleasing given the need
to take a conservative approach on new savings and loans business
during the final stages of systems migration. As we put more than three
years of transition behind us, the Bank is well placed to deliver good
growth, starting in the coming year.
Trading profit was impacted by a number of factors. The unwind of
the fair value provision, dating from the time of acquisition in 2008,
reduced by £133 million in the year, to £22 million, and will be
immaterial going forward. We increased our provision against possible
claims arising from the sale of PPI by £57 million in the first half of the
year. With no further adjustments in the second half, we ended the year
with a net provision of £75 million. Our decision to slow down the final
stages of migration also impacted profit by around £40 million which
will now begin to reverse.
Bad debts reduced by 5.2% in the year due to the application of our
robust credit policy. The Bank’s overall capital position improved, from
an already good position. Liquidity has also improved, with the retail
bond issues giving us greater diversity in the Bank’s funding position.
08/09*
£221m
£250m
£168m
09/10 11/12
Tesco Bank trading profit
£264m
10/11
* On a 2008/09 pro-forma basis.
Group balance sheet
Net debt remained stable for the year at £6.8 billion. This is a little
behind our expectations at the half-year, due to the impact of the
Christmas trading result on cash flow and to lower working capital
inflow, linked to higher stock levels than planned. Group capital
expenditure was slightly below our half-year expectation, at £3.8 billion,
due to tight control of spending. Operating cash flow from retail
operations was down slightly year-on-year, at £3.8 billion, again
affected by lower working capital inflow.
Our strategy to release value from our property portfolio has had
another successful year, generating £376 million of property profits
from around £1 billion of disposals. The launch of our first property
fund in Asia completed successfully after the year end, raising over
£379 million from 17 mature stores and malls in Thailand. With the
fund seeing strong demand on launch, and since trading above its
listing price, this is a strong indication of the overall value of our
operations in Thailand and elsewhere in Asia. The market value
of our global property currently exceeds £37 billion.
Finally, our IAS 19, or accounting, pension deficit increased to
£1.4billion after tax, largely as a consequence of market conditions.
We announced proposed changes to the terms of our defined benefits
scheme in March, in order to make it more sustainable over the long
term. We also made a one-off cash contribution of £180 million to the
scheme after the year end, in anticipation of the forthcoming outcome
of the triennial actuarial valuation, which we believe gives a more
accurate indication of the likely costs of future funding of the scheme.
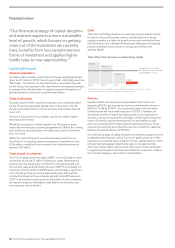
Group financial metrics
A year ago I set out four key financial metrics or measures to help
investors monitor our capital returns performance, debt and overall
balance sheet. Taking each in turn, we have improved return on capital
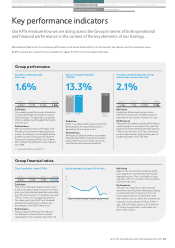
employed (‘ROCE’) from 12.9% last year to 13.3%. This improvement
benefits from Japan now being classified as discontinued as a result
of our decision to exit the market.
10/11
12.9% 13.3%
11/12
13.3% 14.6%
14/15
TARGET
Target return on capital employed
We held our two debt metrics, fixed charge cover and net indebtedness,
broadly flat this year. Both measures will of course be directly affected
by the UK investment plan we have announced for the coming year.
Our target for fixed charge cover is between 4 and 4.5 times and, for
net indebtedness, is 2.5 times.
On our fourth key metric, capital expenditure as a proportion of sales,
we were exactly in the middle of our target range of 5 to 5.5%.
Tesco PLC Annual Report and Financial Statements 2012 35
STRATEGIC REVIEW PERFORMANCE REVIEW GOVERNANCE FINANCIAL STATEMENTSOVERVIEW
Key performance indicators Financial review