Tesco 2012 Annual Report Download - page 37
Download and view the complete annual report
Please find page 37 of the 2012 Tesco annual report below. You can navigate through the pages in the report by either clicking on the pages listed below, or by using the keyword search tool below to find specific information within the annual report.-
 1
1 -
2
-
3
-
4
-
5
-
6
-
7
-
8
-
9
-
10
-
11
-
12
-
13
-
14
-
15
-
16
-
17
-
18
-
19
-
20
-
21
-
22
-
23
-
24
-
25
-
26
-
 27
27 -
 28
28 -
 29
29 -
 30
30 -
 31
31 -
 32
32 -
 33
33 -
 34
34 -
 35
35 -
 36
36 -
 37
37 -
 38
38 -
 39
39 -
 40
40 -
 41
41 -
 42
42 -
 43
43 -
 44
44 -
 45
45 -
 46
46 -
 47
47 -
48
-
49
-
50
-
51
-
52
-
53
-
54
-
55
-
56
-
57
-
58
-
59
-
60
-
61
-
62
-
63
-
64
-
65
-
66
-
67
-
68
-
69
-
70
-
71
-
72
-
73
-
74
-
75
-
76
-
77
-
78
-
79
-
80
-
81
-
82
-
83
-
84
-
85
-
86
-
87
-
88
-
89
-
90
-
91
-
92
-
93
-
94
-
95
-
96
-
97
-
98
-
99
-
100
-
101
-
102
-
103
-
104
-
105
-
106
-
107
-
108
-
109
-
110
-
111
-
112
-
113
-
114
-
115
-
116
-
117
-
118
-
119
-
120
-
121
-
122
-
123
-
124
-
125
-
126
-
127
-
128
-
129
-
130
-
131
-
132
-
133
-
134
-
135
-
136
-
137
-
138
-
139
-
140
-
141
-
142
-
143
-
144
-
145
-
146
-
147
-
148
-
149
-
150
-
151
-
152
-
153
-
154
-
155
-
156
-
157
-
158
 |
 |

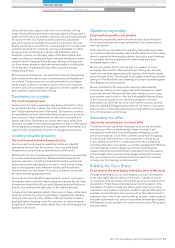
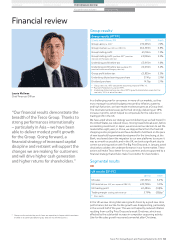
Laurie McIlwee
Chief Financial Officer
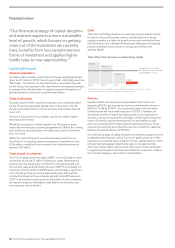
“Our financial results demonstrate the
breadth of the Tesco Group. Thanks to
strong performances internationally
– particularly in Asia – we have been
able to deliver modest profit growth
for the Group. Going forward, a
financial strategy of increased capital
discipline and restraint will support the
changes we are making for customers
and will drive higher cash generation
and higher returns for shareholders.”
Group results∆
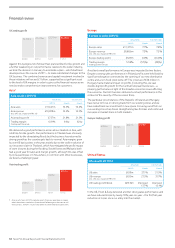
Group results 2011/12
52 weeks ended 25 February 2012 2011/12 Growth
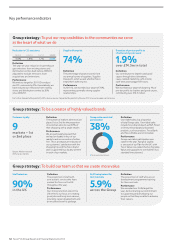
Group sales (inc. VAT)*£72,035m 7.4%
Group revenue (exc. VAT, inc. IFRIC 13) £64,539m 6.8%
Group trading profit £3,761m 1.3%
Group trading profit (pre Bank PPI** provision
increase and Hungary sales tax)
£3,856m 5.2%
Underlying profit before tax £3,915m 1.6%
Underlying profit before tax (pre Bank PPI
provision increase and Hungary sales tax)
£4,010m 5.4%
Group profit before tax £3,835m 5.3%
Underlying diluted earnings per share 37.41p 2.1%†
Dividend per share 14.76p 2.1%
* Group sales (inc. VAT) exclude the accounting impact of IFRIC 13.
** Payment Protection Insurance (‘PPI’).
† Underlying diluted earnings per share (‘EPS’) growth calculated on a constant tax
rate basis; 3.2% at actual tax rates.
In a challenging year for consumers in many of our markets, as they
try to manage household budgets pressured by inflation, austerity
and high fuel prices, we have made modest progress at a Group level.
The international businesses performed strongly, delivering an 18%
increase in profits, which helped to compensate for the reduction in
trading profit in the UK.
We have acted where our strategy was not delivering as we had hoped. In
the United States, we reduced losses, moving towards break-even, before
accelerating investment; in Japan, we announced our decision to exit the
market after eight years; in China, we stepped back from the freehold
shopping centre programme and have decided to hold back on the pace
of new leasehold hypermarket development for the time being; at the
Bank, we slowed down the migration to our own platforms to ensure it
was as smooth as possible; and in the UK, we took a significant step to
correct our pricing position with The Big Price Drop and, in January, acted
decisively to address the underperformance in our home market. These
actions will make Tesco better for our customers and are supported by a
financial strategy that will also make Tesco better for shareholders.
Segmental results
UK
UK results 2011/12
2011/12 Growth
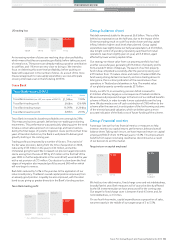
UK sales £47,355m 6.2%
UK revenue (exc. VAT, exc. impact of IFRIC 13) £42,798m 5.0%
UK trading profit £2,480m (1.0)%
Trading margin (trading profit/revenue) 5.79% (35)bp
*
* Basis points.
In the UK we saw strong total sales growth driven by a good new store
performance, but our like-for-like growth was disappointing, particularly
in the second half of the year. This was not helped by reduced inflation
resulting from our Big Price Drop and a weak Christmas, which was
affected by the substantial increase in competitor couponing activity.
Like-for-like sales growth recovered somewhat after Christmas.
∆ Group results exclude the results from our operation in Japan which have been
treated as discontinued following our decision to sell the business.
Tesco PLC Annual Report and Financial Statements 2012 33
STRATEGIC REVIEW PERFORMANCE REVIEW GOVERNANCE FINANCIAL STATEMENTSOVERVIEW
Key performance indicators Financial review
Financial review