Tesco 2012 Annual Report Download - page 156
Download and view the complete annual report
Please find page 156 of the 2012 Tesco annual report below. You can navigate through the pages in the report by either clicking on the pages listed below, or by using the keyword search tool below to find specific information within the annual report.-
 1
1 -
2
-
3
-
4
-
5
-
6
-
7
-
8
-
9
-
10
-
11
-
12
-
13
-
14
-
15
-
16
-
17
-
18
-
19
-
20
-
21
-
22
-
23
-
24
-
25
-
26
-
27
-
28
-
29
-
30
-
31
-
32
-
33
-
34
-
35
-
36
-
37
-
38
-
39
-
40
-
41
-
42
-
43
-
44
-
45
-
46
-
47
-
48
-
49
-
50
-
51
-
52
-
53
-
54
-
55
-
56
-
57
-
58
-
59
-
60
-
61
-
62
-
63
-
64
-
65
-
66
-
67
-
68
-
69
-
70
-
71
-
72
-
73
-
74
-
75
-
76
-
77
-
78
-
79
-
80
-
81
-
82
-
83
-
84
-
85
-
86
-
87
-
88
-
89
-
90
-
91
-
92
-
93
-
94
-
95
-
96
-
97
-
98
-
99
-
100
-
101
-
102
-
103
-
104
-
105
-
106
-
107
-
108
-
109
-
110
-
111
-
112
-
113
-
114
-
115
-
116
-
117
-
118
-
119
-
120
-
121
-
122
-
123
-
124
-
125
-
126
-
127
-
128
-
129
-
130
-
131
-
132
-
133
-
134
-
135
-
136
-
137
-
138
-
139
-
140
-
141
-
142
-
143
-
144
-
145
-
 146
146 -
 147
147 -
 148
148 -
 149
149 -
 150
150 -
 151
151 -
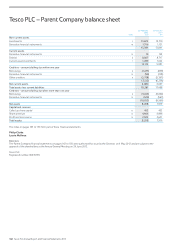
 152
152 -
 153
153 -
 154
154 -
 155
155 -
 156
156 -
 157
157 -
 158
158
 |
 |

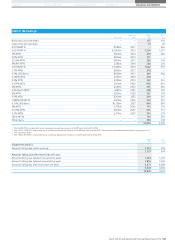
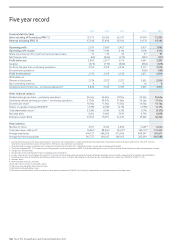
Five year record
2008 2009 2010 2011 1 2012 1
Financial statistics (£m)
Sales including VAT excluding IFRIC 13 51,773 59,426 62,537 67,074 72,035
Revenue excluding IFRIC 13 47,298 53,898 56,910 61,174 65,166
Operating profit22,791 3,16933,457 3,917 3,985
Operating profit margin25.9% 5.9% 6.1% 6.4% 6.1%
Share of post-tax profits of joint ventures and associates 75 110 33 57 91
Net finance costs (63) (362) (314) (333) (241)
Profit before tax 2,803 2,91733,176 3,641 3,835
Taxation (673) (779) (840) (864) (879)
Profit for the year from continuing operations 2,130 2,138 2,336 2,777 2,956
Discontinued operations – – – (106) (142)
Profit for the period 2,130 2,138 2,336 2,671 2,814
Attributable to:
Owners of the parent 2,124 2,13332,327 2,655 2,806
Non-controlling interests 6 5 9 16 8
Underlying profit before tax – continuing operations42,846 3,124 3,395 3,853 3,915
Other financial statistics
Diluted earnings per share – continuing operations 26.61p 26.96p 29.19p 34.25p 36.64p
Underlying diluted earnings per share – continuing operations 27.02p 28.87p 31.66p 36.26p 37.41p
Dividend per share510.90p 11.96p 13.05p 14.46p 14.76p
Return on capital employed (‘ROCE’)412.7%612.8%712.1% 12.9%813.3%
Total shareholder return422.8% 8.0% 9.5% 6.7% (3.0%)
Net debt (£m) 6,182 9,600 7,929 6,790 6,838
Enterprise value9 (£m) 37,656 35,907 41,442 39,462 32,324
Retail statistics
Number of stores 3,751 4,332 4,836 5,26510 6,234
Total sales area – 000 sq ft11 76,86712 88,55612 95,23113 103,17210 112,433
Average employees 444,127 468,508 472,094 488,347 519,671
Average full-time equivalents 345,737 364,015 366,413 382,049 406,088
1 During the financial year, the Group announced its decision to sell its operations in Japan. Accordingly, these operations have been treated as discontinued in 2012. The 2011 statistics
have been re-presented to be consistent with 2012. Prior years have not been re-presented.
2 Operating profit includes integration costs and profit arising on sale of fixed assets. Operating margin is based upon revenue excluding VAT.
3 The Group adopted IFRIC 13 ‘Customer Loyalty Programmes’ and the amendments to IFRS 2 ‘Share-Based Payment’ from 24 February 2008. Periods before this date have not been restated.
4 See glossary for definitions.
5 Dividend per share relating to the interim and proposed final dividend.
6 Using a ‘normalised’ tax rate before start-up costs in the US and Tesco Direct and excluding the impact of foreign exchange in equity and our acquisition of a majority share of Dobbies.
7 Excluding acquisition of Tesco Bank and Homever, India start-up costs, and after adjusting for assets held for sale. Calculated on a 52-week basis, ROCE for 2009 is 12.8%.
8 Includes Japan.
9 Market capitalisation plus net debt.
10 Includes franchise stores but excludes Japan.
11 Store sizes exclude lobby and restaurant areas.
12 Restated to include Dobbies stores.
13 Restated to include Dobbies stores and account for a space restatement of 109,000 sq ft driven by a comprehensive remeasurement of One Stop stores.
152 Tesco PLC Annual Report and Financial Statements 2012