Tesco 2012 Annual Report Download - page 34
Download and view the complete annual report
Please find page 34 of the 2012 Tesco annual report below. You can navigate through the pages in the report by either clicking on the pages listed below, or by using the keyword search tool below to find specific information within the annual report.-
 1
1 -
2
-
3
-
4
-
5
-
6
-
7
-
8
-
9
-
10
-
11
-
12
-
13
-
14
-
15
-
16
-
17
-
18
-
19
-
20
-
21
-
22
-
23
-
 24
24 -
 25
25 -
 26
26 -
 27
27 -
 28
28 -
 29
29 -
 30
30 -
 31
31 -
 32
32 -
 33
33 -
 34
34 -
 35
35 -
 36
36 -
 37
37 -
 38
38 -
 39
39 -
 40
40 -
 41
41 -
 42
42 -
 43
43 -
 44
44 -
45
-
46
-
47
-
48
-
49
-
50
-
51
-
52
-
53
-
54
-
55
-
56
-
57
-
58
-
59
-
60
-
61
-
62
-
63
-
64
-
65
-
66
-
67
-
68
-
69
-
70
-
71
-
72
-
73
-
74
-
75
-
76
-
77
-
78
-
79
-
80
-
81
-
82
-
83
-
84
-
85
-
86
-
87
-
88
-
89
-
90
-
91
-
92
-
93
-
94
-
95
-
96
-
97
-
98
-
99
-
100
-
101
-
102
-
103
-
104
-
105
-
106
-
107
-
108
-
109
-
110
-
111
-
112
-
113
-
114
-
115
-
116
-
117
-
118
-
119
-
120
-
121
-
122
-
123
-
124
-
125
-
126
-
127
-
128
-
129
-
130
-
131
-
132
-
133
-
134
-
135
-
136
-
137
-
138
-
139
-
140
-
141
-
142
-
143
-
144
-
145
-
146
-
147
-
148
-
149
-
150
-
151
-
152
-
153
-
154
-
155
-
156
-
157
-
158
 |
 |
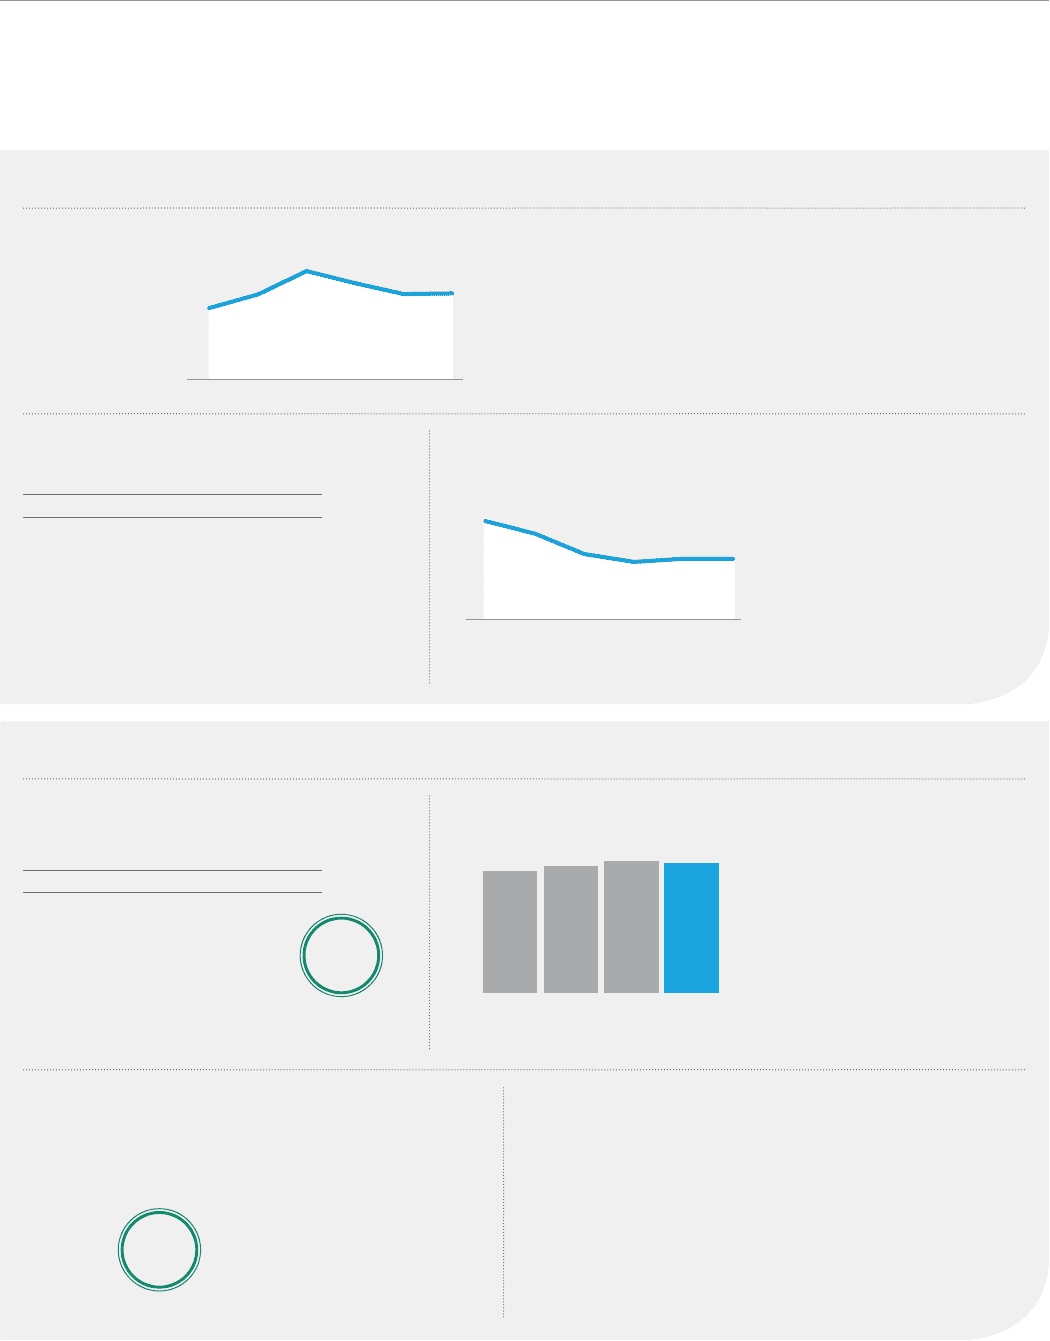
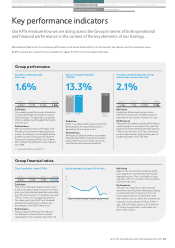
Group financial ratios continued
Key performance indicators
1
2
3
4
11/1210/1109/1008/0907/0806/07
Times
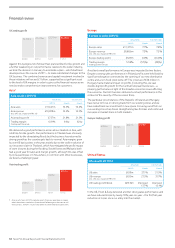
Net indebtedness Definition
Net indebtedness shows debt in
relation to operating cashflow
(‘EBITDAR’). Debt is adjusted net
debt, calculated as net debt, the
pension deficit and the net present
value of lease obligations.
Performance
Net indebtedness remained
broadly flat, reflecting a slower
than expected working capital
improvement and higher pension
deficit, offset by cash generated
from retail operations (excluding
workingcapital). Our target for net
indebtedness is 2.5 times.
2
4
6
8
11/1210/1109/1008/0907/0806/07
Times
Gearing Fixed charge cover Definition
The number of times that our
operating cashflow (‘EBITDAR’)
covers our debt obligations (largely
rent and interest payments).
Performance
Our fixed charge cover remained
broadly flat due to increased rent
offsetting our reduced interest and
increase in operating cashflow
(‘EBITDAR’). Our target is a level of
cover in the band of 4 to 4.5 times.
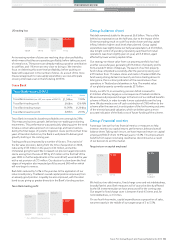
08/09 09/10 10/11 11/12
74.4%* 54.0% 40.8% 38.4%†
Definition
The proportion of net assets financed through debt rather
than equity, calculated as net debt divided by total equity.
Performance
Our gearing continued to decrease, reflecting our stable
debt position despite our investment in assets growing.
* Restated for IFRS 2 and IFRIC 13.
† Includes Japan.
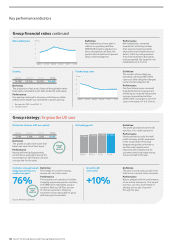
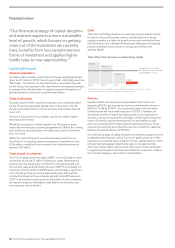
Group strategy: To grow the UK core
UK trading profit
FOCUS
FOR
2012/13
08/09 09/10
£2,309m £2,413m
10/11 11/12
£2,504m £2,480m
UK like-for-like (inc. VAT, exc. petrol)
08/09 09/10 10/11 11/12
3.0% 2.6% 1.0% 0.0%
Definition
The growth in sales from stores that
have been open for at least a year.
Performance
Having delivered a disappointing
performance, particularly during the
second half, our UK Plan aims to drive
stronger like-for-like sales.
Definition
The profit generated from the UK
business in its retail operations.
Performance
Having delivered a solid first half
profit outcome, profits weakened
in the second half, reflecting a
disappointing sales performance
and the initial investment in
improving the shopping trip for
customers which we began during
the second half of the year.
76% +10%
Customer rating of overall
shopping experience as
excellent or good
Growth in UK
online sales
FOCUS
FOR
2012/13
Definition
Percentage of customer ratings,
measured in exit interviews.
Performance
Three quarters of customers find their
shopping experience good or excellent,
and 98% find it reasonable, good or
excellent. With our UK Plan, we aim
to improve customers’ shopping
experiences from reasonable to good
and from good to excellent.
Definition
The year-on-year sales growth from
total tesco.com and online telecoms.
Performance
We are pleased with the performance
of our online businesses. Our largest
business, grocery, accelerated its
already strong rate of growth
through the year.
Source: Marketing Sciences.
30 Tesco PLC Annual Report and Financial Statements 2012