Supercuts 2005 Annual Report Download - page 97
Download and view the complete annual report
Please find page 97 of the 2005 Supercuts annual report below. You can navigate through the pages in the report by either clicking on the pages listed below, or by using the keyword search tool below to find specific information within the annual report.-
 1
1 -
2
-
3
-
4
-
5
-
6
-
7
-
8
-
9
-
10
-
11
-
12
-
13
-
14
-
15
-
16
-
17
-
18
-
19
-
20
-
21
-
22
-
23
-
24
-
25
-
26
-
27
-
28
-
29
-
30
-
31
-
32
-
33
-
34
-
35
-
36
-
37
-
38
-
39
-
40
-
41
-
42
-
43
-
44
-
45
-
46
-
47
-
48
-
49
-
50
-
51
-
52
-
53
-
54
-
55
-
56
-
57
-
58
-
59
-
60
-
61
-
62
-
63
-
64
-
65
-
66
-
67
-
68
-
69
-
70
-
71
-
72
-
73
-
74
-
75
-
76
-
77
-
78
-
79
-
80
-
81
-
82
-
83
-
84
-
85
-
86
-
 87
87 -
 88
88 -
 89
89 -
 90
90 -
 91
91 -
 92
92 -
 93
93 -
 94
94 -
 95
95 -
 96
96 -
 97
97 -
 98
98 -
 99
99 -
 100
100 -
 101
101 -
 102
102 -
 103
103 -
 104
104 -
 105
105 -
 106
106 -
 107
107 -
108
-
109
-
110
-
111
-
112
-
113
-
114
-
115
-
116
-
117
-
118
-
119
-
120
-
121
 |
 |

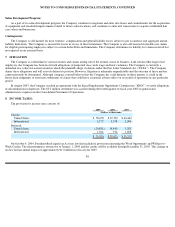
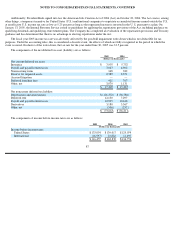
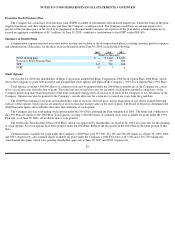
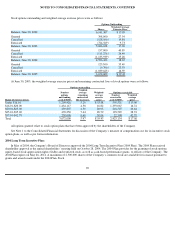
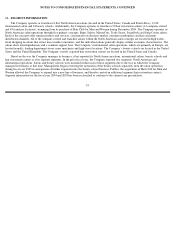
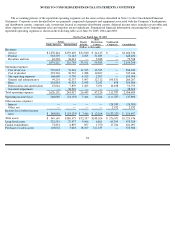
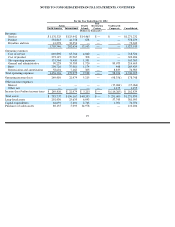
NOTES TO CONSOLIDATED FINANCIAL STATEMENTS, CONTINUED
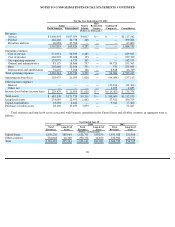
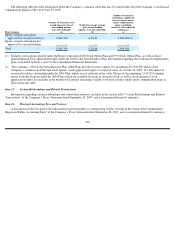
Total revenues and long-lived assets associated with business operations in the United States and all other countries in aggregate were as
follows:
96
For the Year Ended June 30, 2003
Salons
Beauty
Hair
Restoration
Unallocated
North America
International
Schools
Centers
Corporate
Consolidated
(Dollars in thousands)
Revenues:
Service
$
1,006,491
$
107,054
$
4,017
$
—
$
—
$
1,117,562
Product
464,240
34,778
268
—
—
499,286
Royalties and fees
40,088
27,594
—
—
—
67,682
1,510,819
169,426
4,285
—
—
1,684,530
Operating expenses:
Cost of service
571,951
56,509
1,485
—
—
629,945
Cost of product
236,878
20,308
153
—
—
257,339
Site operating expenses
135,073
6,735
365
—
—
142,173
General and administrative
83,175
26,866
797
—
84,725
195,563
Rent
202,660
32,106
351
—
531
235,648
Depreciation and amortization
52,607
5,208
106
—
8,828
66,749
Total operating expenses
1,282,344
147,732
3,257
—
94,084
1,527,417
Operating income (loss)
228,475
21,694
1,028
—
(
94,084
)
157,113
Other income (expense):
Interest
—
—
—
—
(
21,394
)
(21,394
)
Other, net
—
—
—
—
1,055
1,055
Income (loss) before income taxes
$
228,475
$
21,694
$
1,028
$
—
$
(
114,423
)
$
136,774
Total assets
$
683,298
$
171,729
$
9,319
$
—
$
248,609
$
1,112,955
Long
-
lived assets
274,649
22,493
1,662
—
57,921
356,725
Capital expenditures
63,496
4,622
—
—
9,342
77,460
Purchases of salon assets
68,109
19,659
3,859
—
—
91,627
Year Ended June 30,
2005
2004
2003
Total
Revenues
Long
-
lived
Assets
Total
Revenues
Long
-
lived
Assets
Total
Revenues
Long
-
lived
Assets
(Dollars in thousands)
United States
1,870,226
388,964
1,632,791
340,250
1,451,568
321,988
Other countries
324,068
46,360
290,352
41,653
232,962
34,737
Total
2,194,294
435,324
1,923,143
381,903
1,684,530
356,725